Climate and Glowworm Monitoring at the Waitomo Glowworm Cave, New Zealand
Environmental Officer, Waitomo Glowworm Cave, Waitomo, New Zealand
Abstract
This paper discusses two aspects of environmental monitoring at the Waitomo Glowworm Cave. The first is the automated climate monitoring system — the equipment in use, the purpose of the system, and its role in day-to-day cave management. The second topic outlines recent attempts to use photomonitoring methods to census the glowworm population.
Introduction
The Waitomo Glowworm Cave is situated in New Zealand’s North Island, approximately 3 hours south of Auckland. It is a relatively small cave, with a passage length around 700m on two levels. The lowest level is a stream passage that contains a spectacular display of the bioluminescent glowworm, larval stage of the dipteran Arachnocampa luminosa. The cave was first explored in 1887 and has operated as a tourist cave since 1889. At the height of visitation (1996) visitor numbers reached over 400,000 per year. In 2008 there were 261,000 visitors to the cave.
Serious concerns over the cave’s wellbeing and management practices were first voiced during the early 1970s. A period of research ensued, eventually leading to the formation of a scientific advisory group. Today that group is the Environmental Advisory Group (EAG). The role of the EAG is to advise the cave’s operator on the protection and management of the cave and its contents.
Two key aspects of cave protection are managing the cave’s microclimate and protecting the glowworm display. An automated climate monitoring system has been in operation since 1998. Many alterations and improvements have been made to the system during this time. Quantitative glowworm monitoring has been attempted in the past but a robust, long-term monitoring programme is still evolving.
Waitomo Glowworm Cave climate monitoring
Climate processes
The Waitomo Glowworm Cave has an upper abandoned phreatic level and an active lower vadose level. Each level contains an entrance. From its submergence, the stream flows through the Glowworm Grotto, sumps, resurges at the Demonstration Chamber then sumps again before resurging into the Waitomo Stream (Figure 1). The upper levels connect to the stream level in several places. The upper entrance was artificially enlarged soon after discovery to allow tourist access, and a door was later added for security. The door also allows cave climate to be managed.
The fundamental climate process in the cave is the airflow that occurs when a thermal gradient exists between inside (cave) and outside air. An upward airflow occurs when outside temperatures are cooler than the cave, as warm air rises out the top entrance. A downward flow occurs when outside temperatures are warmer than the cave, as cold air flows out the lower entrance. The door can be used to control the ventilation rate of the cave. Upward and downward flows are often associated with winter and summer respectively (Figure 2).
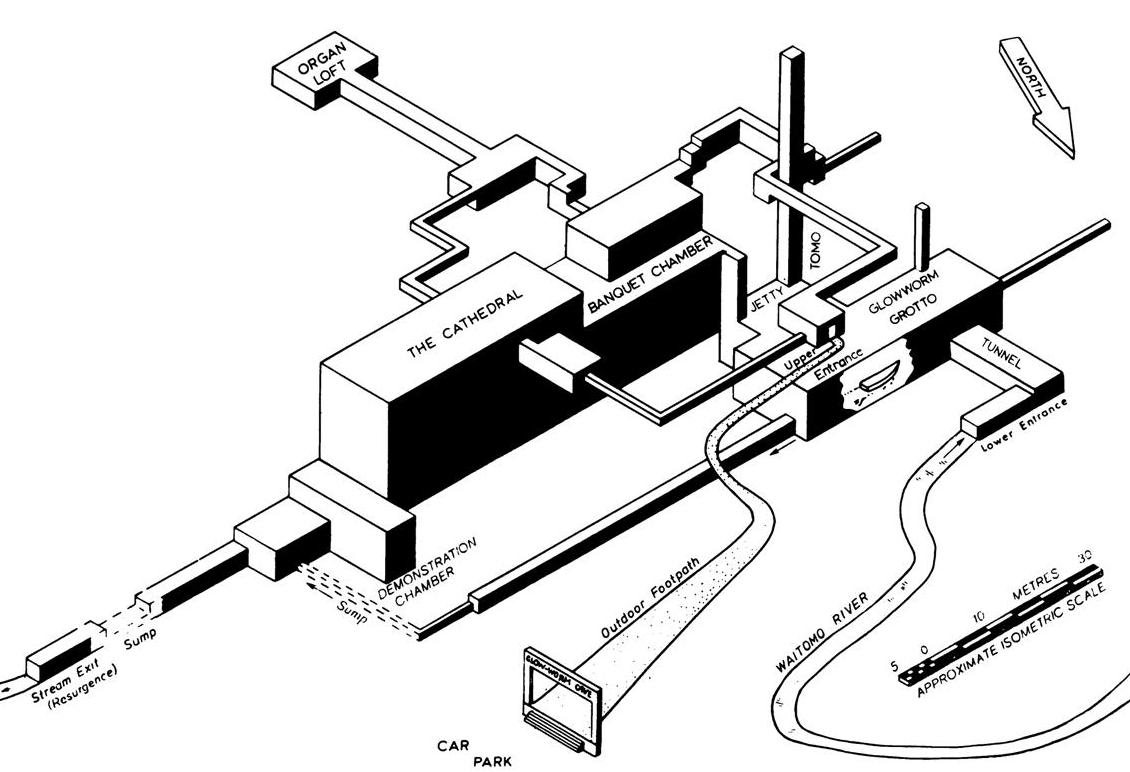
Figure 1. Schematic layout of Waitomo Glowworm Cave (from de Freitas et al., 1982)
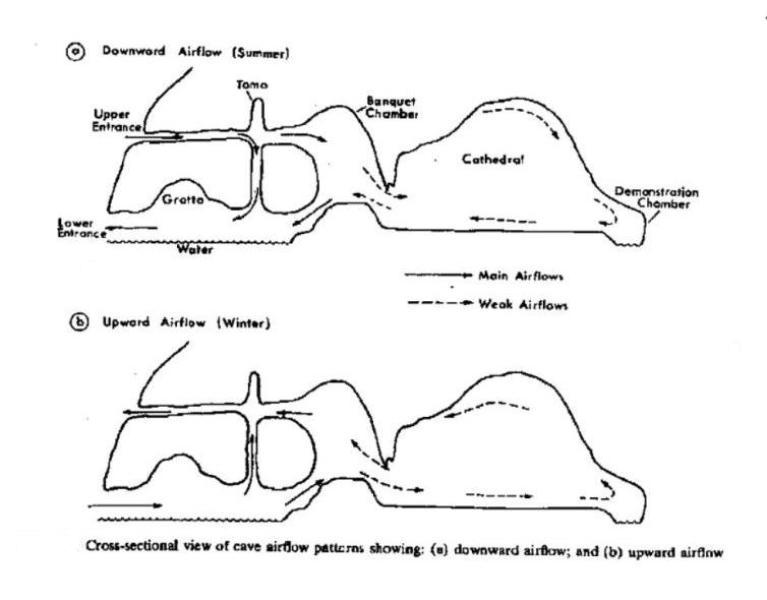
Figure 2. Cross-section of the Waitomo Glowworm Cave showing airflow patterns when outside air is cooler or warmer than cave air (from de Freitas et al., 1982)
Why monitor cave climate?
There are several reasons for monitoring cave climate in the Waitomo Glowworm Cave. The primary reason is to ensure tourism has minimal negative effect on the cave, the glowworm display and other cave features. Real-time climate data enables day to day environmental management decisions to be made as climate conditions, visitor numbers and other parameters change. Underlying this, the cave operator, Tourism Holdings Limited (THL), are obliged to look after the cave to a level specified in a lease agreement with the cave owners, the Ruapuha Uekaha Hapu Trust and the Department of Conservation. The lease includes requirements to monitor cave climate.
Potential effects of cave climate
Several climate conditions can have negative effects in the cave.
Excessive drying (evaporation) causes glowworm desiccation and damage to speleothems and other cave surfaces. These conditions occur with increased air movement, changes in temperature and reduced humidity.
Higher temperatures cause the glowworm killing fungus Tolypocladium extinguens to become more virulent (Figure 3a).
Low ventilation rates and/or high visitation rates lead to high carbon dioxide (CO2) levels. This in turn increases CO2 levels in percolation and condensation waters, leading to the corrosion of speleothems and rock surfaces. The Organ Loft is a dead-end passage that is particularly susceptible to CO2 build up and has sustained condensation corrosion damage in the past (Figure 3b). Currently, tours in Organ Loft are restricted to early morning or late afternoon.
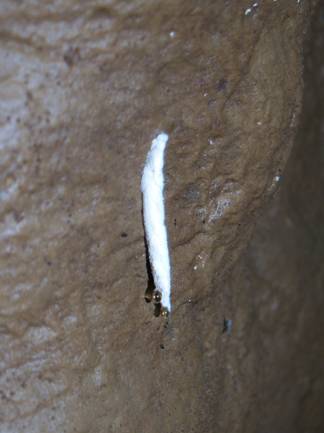
Figure 3a) Glowworm larva affected by the fungus Tolypocladium extinguens, which becomes more virulent at higher temperatures
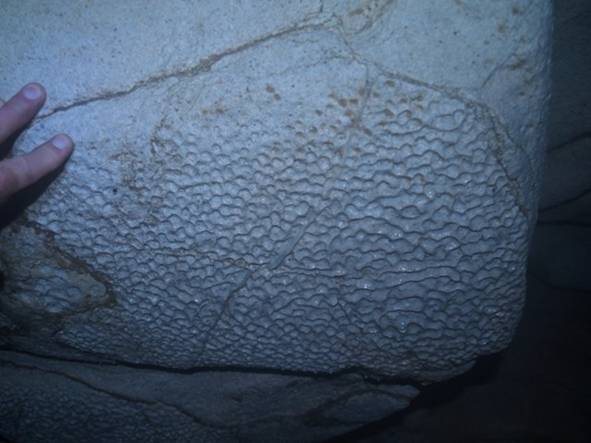
Figure 3b) Example of condensation corrosion in the Organ Loft caused by historical high CO2 levels (before real-time monitoring and ventilation management)
Automated climate monitoring system
Dataloggers
Climate monitoring at the Waitomo Glowworm Cave uses a network of 3 linked Campbell CR10x dataloggers: a master logger with 2 slave loggers. Data is collected and stored on the dataloggers, which are downloaded and archived every two weeks.
Data is also displayed real-time in the day supervisor’s office. The real-time data is transferred to the supervisor’s office via approximately 100m of 8 core copper cable. The data logger output signal is RS232, which does not travel well over long distances, so it is converted to RS485 then back to RS232 once it reaches the supervisor’s office. In the future, fibre optic cable with a digital signal may be investigated, to avoid any possible electrical interference.
Sensors
Carbon dioxide is measured using non-dispersive infrared Vaisala CO2 sensors with a 0-5000 ppm range. Temperature and humidity is measured using aspirated wet/dry bulb psychrometers with Campbell 107 sensors. Aspirated wet/dry bulb psychrometers are the most reliable way of accurately measuring high levels of humidity, such as those typically found in cave environments. Airspeed and direction are measured using a Young ultrasonic anemometer. An ultrasonic anemometer can measure airflow at lower intensities than a cup anemometer, and doesn’t have the moving parts that require greater maintenance, or can fail, in the harsh cave environment. Outside temperature is measured with a Campbell CS500 temperature/humidity probe. Rock temperature is measured at 3 and 6 cm depths using bead thermistors. Rock temperature was initially measured using Campbell 107 sensors but these proved to be unsuitable. Experimental work is underway to determine better ways of measuring rock temperature. A magnetic switch records whether the door is open or closed.
Monitoring sites
Carbon dioxide is measured at two sites, cave temperature and humidity at three sites, airflow direction and speed at one site and rock temperature at one site. Outside temperature and humidity is measured in the forest near the top cave entrance (Figure 4). Climate parameters are logged at 10 minute, 30 minute or 4 hour intervals. Sensors were installed at sites that were thought to be key points for observing cave climate. Sites are sometimes changed under the advice of the EAG, as understanding of the cave increases. Proposed new sites are tested and correlated by experimentation with portable loggers.
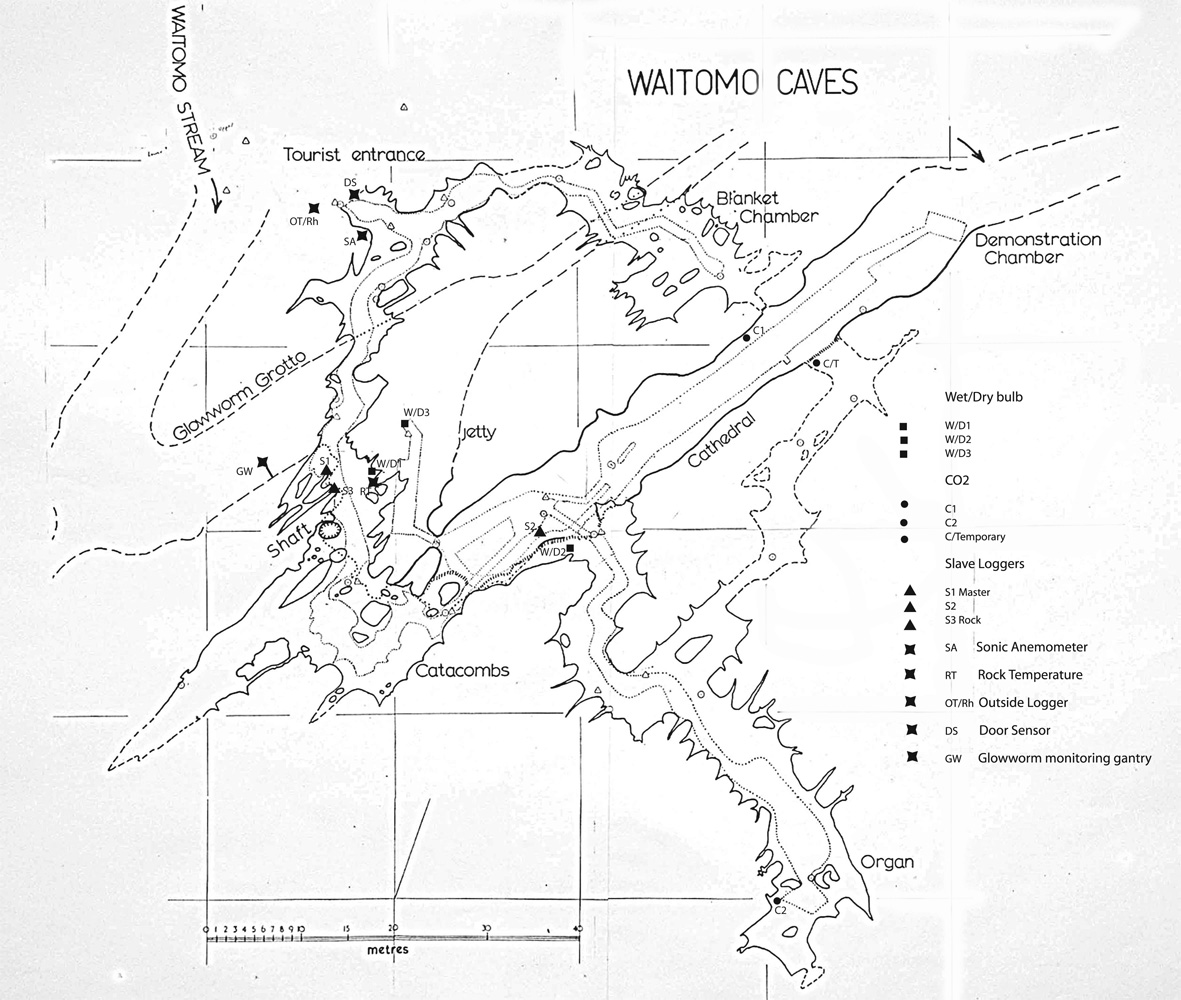
Figure 4. Waitomo Glowworm Cave logger and sensor locations
Real-time climate data and day to day cave management
Real-time climate data is used to manage the cave on a day-to-day and hour-to-hour basis, as outside climate conditions and visitor numbers change. All attempts are made to try and keep the cave within a predetermined set of parameters (table 1).
| Climate parameter and target | Management method |
| CO2 < 2400 ppm | Open door, limit or stop tours |
| Temperature 14-16°C | Keep door closed |
| Relative humidity > 98% | Keep door closed |
| Vapour pressure deficit < 0 | Keep door closed |
| Airflow - minimise | Keep door closed |
Table 1. Climate parameters and management methods
As can be seen in Table 1, the method for minimising cave carbon dioxide levels can conflict with managing temperature, humidity and airflow. The means there is often a balance between managing one parameter and another. In practice, high CO2 levels occur in summer when visitation is high, but excess ventilation is thought to be more concerning in winter when cold air can enter the Glowworm Grotto and cause glowworm desiccation. A reliable real-time monitoring system is important particularly on days when CO2 approaches the upper limit and ventilation or tour restriction are required. Table 2 shows the management strategy used by day supervisors to keep CO2 levels below the 2400 ppm limit as levels rise and fall. Figure 5 gives a month of CO2 data (December 2008) with some examples of the causes of high CO2 and how opening the door can influence CO2 levels.
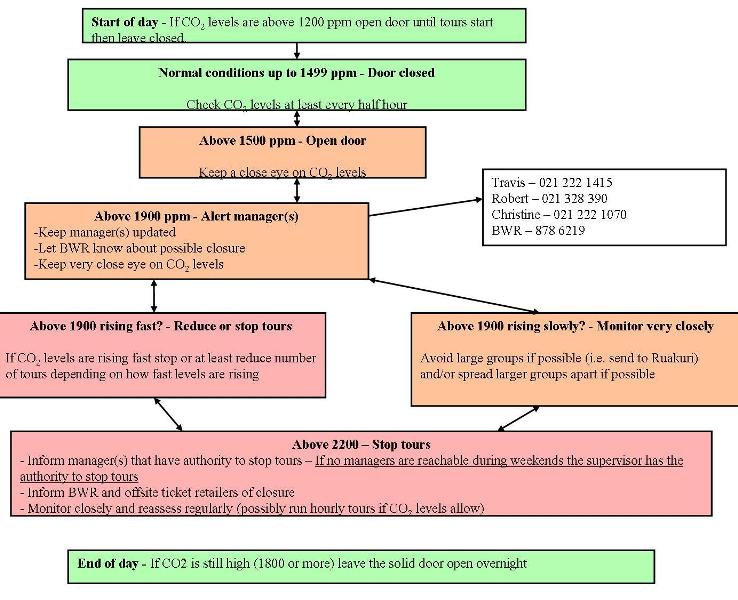
Table 2. Flow chart used to manage CO2 levels in the Glowworm Cave on a day-to-day basis
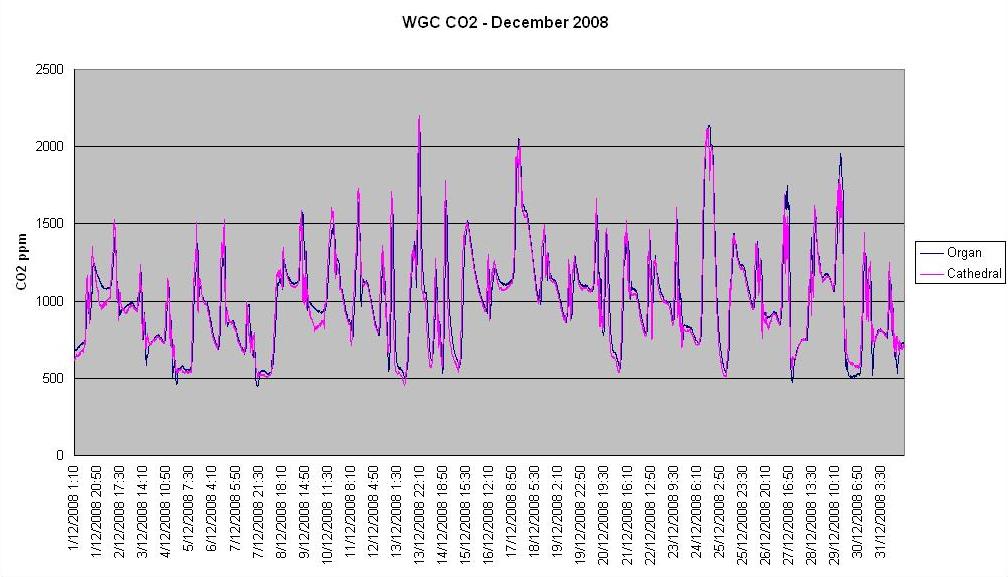
Figure 5. Plot of Glowworm Cave CO2 at the Organ Loft and Cathedral for December 2008. Arrows show some of the factors that have caused levels to rise plus 1 occasion that shows a sharp reduction of CO2 resulting from using the cave door as a CO2 reducing management tool
Climate monitoring – latest refinements and developments
As a result of the Environmental Advisory Group reviewing climate data biannually, management practices and logger network refinements are continually being made. An example of this is a year-long study in the Glowworm Grotto. Four temperature loggers showed that the temperature/humidity sensor site at the boat loading area was slightly different from the rest of the Grotto, possibly due to people waiting for the Glowworm Grotto boat ride. Since the objective of this sensor was to measure climatic changes affecting the core glowworm population, it was decided that the sensor site needed to be moved further out into the Glowworm Grotto.
Another example of refinement to the network is the current investigation to identify a better site for the Cathedral CO2 sensor. Calibrating the sensor requires abseiling down the Cathedral wall to gain access. An alternative site with better access is under investigation, using a portable data logger to determine how the new site’s CO2 record will correlate to the current site.
A new development is a study, by a University of Waikato MSc student supervised by EAG member Dr Chris Hendy, entitled “Non-anthropogenic Sources of Carbon Dioxide in the Waitomo Glowworm Cave, Waitomo”. The main finding of this THL-funded study was that the Waitomo Stream is a CO2 sink during normal flow and a CO2 source during high river flow. The study also found that drip-water entering the cave during rain events can have CO2 concentrations greater than 5000 ppm. The study recommends leaving the cave door open during rain to prevent CO2 rising, if it appears that the river will rise. Ventilation is safe because while it is raining, the outside air is humid so the risk of drying out the cave is low.
Glowworm monitoring
Glowworm population counts have been attempted in the past but a robust, ongoing system has yet to be developed. Work has been underway over the last year to develop a census photomonitoring system. The aim is to incorporate the whole or a large proportion of the Glowworm Grotto ceiling population. This section reports on why monitoring is needed, and the methods and results to date.
Why monitor glowworm numbers?
Glowworms are a key attraction in the cave. Monitoring is being established to gain a better understanding of the glowworm population. If there was a subtle long term decline in glowworm numbers it might not be picked up under current environmental monitoring which was based on quadrates at the edges of the main population. The aim is to better identify any changes in glowworm numbers, seasonal population variation and to give warning of any gradual or dramatic reduction in numbers i.e. from the effects of tourism or from catchment issues.
Method in development
Photomonitoring of the Glowworm Grotto ceiling has been attempted by taking a sweep of overlapping digital photographs running the length of the Grotto. Photographs are taken from a wall-mounted boom. Each photograph overlaps the next by about one third (roughly 15° intervals) along the length of the Grotto. Attempts at using a 1970s glowworm study site proved problematic because the boom was not perpendicular to the Grotto wall causing skewed photographs. This was rectified by finding a new site that allowed the boom to be mounted perpendicular to the Grotto wall and as near as possible to the centre of the Grotto. Photographs from this site are easily repeatable between photomonitoring visits. The main difficulty is that the best monitoring site is only accessible by boat.
The photographs are taken from an extendable aluminium boom attached to the cave wall by a single stainless steel bolt (removable type bolt). The boom extends 2 m towards the middle of the passage (Figure 6). A digital SLR camera is attached to the boom head, which is adjustable in 3D and marked with increments of degrees. An infrared camera remote is used to trigger the camera in order to avoid bumping or shaking the boom. The camera is “zeroed” directly upward using a bulls eye (circular bubble) level rested on the camera lens. Photos are then taken at ~ 15° intervals, panning through a vertical plane from 30° downstream to 30° upstream.
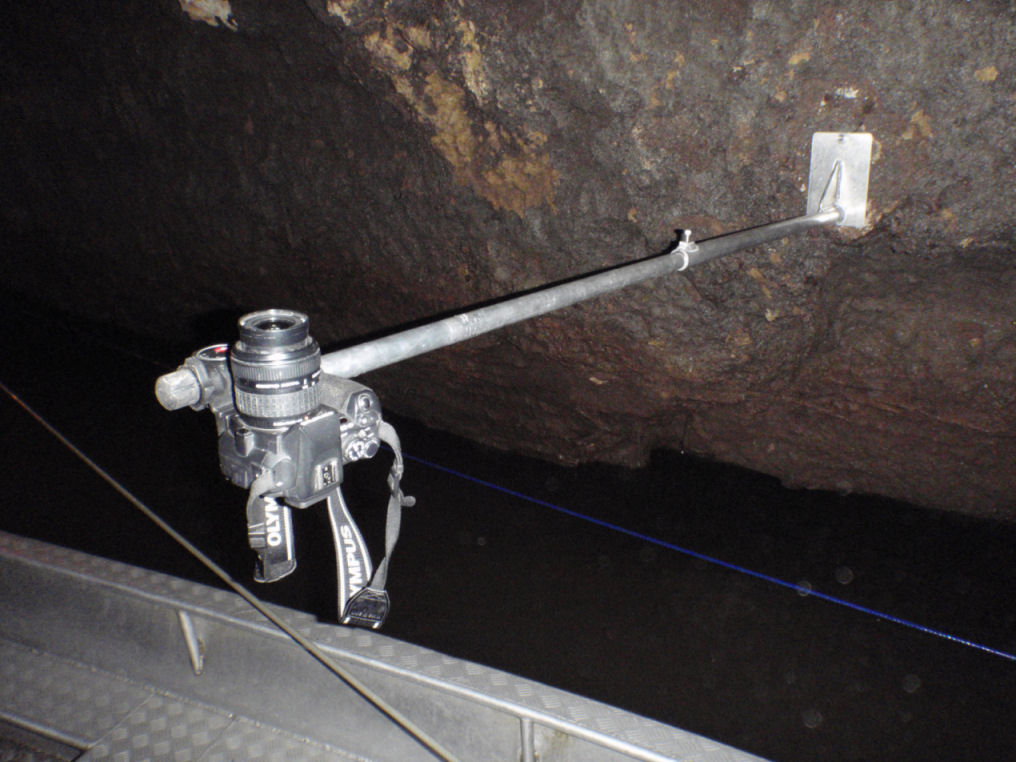
Figure 6. Monitoring boom and camera set up
Camera and settings
The camera used is an Olympus E-500 SLR with a 17.5 - 45 mm lens. Manual camera settings are used with the lens zoomed out to its widest field of view. Exposure settings between 20 and 60 seconds were trialled with 60 seconds proving to be the best. ISO is set to 800 and f-stop to 3.6. Autofocus and noise reduction are set on with the flash off.
Photograph processing
Once photographs are taken they are stitched together, creating one large picture of the Grotto ceiling. In this case, Canon stitch is used but any photo stitching program could probably be used. However, it was found that it is important to check photos prior to stitching to make sure there are good clusters of glowworms for the software program to make good stitching matches. The program can occasionally stitch the photographs together in the wrong places so it is important to check the stitched seams. The original photographs are archived. Figure 7 is an example of 1 glowworm photograph from a set of 5 prior to stitching.
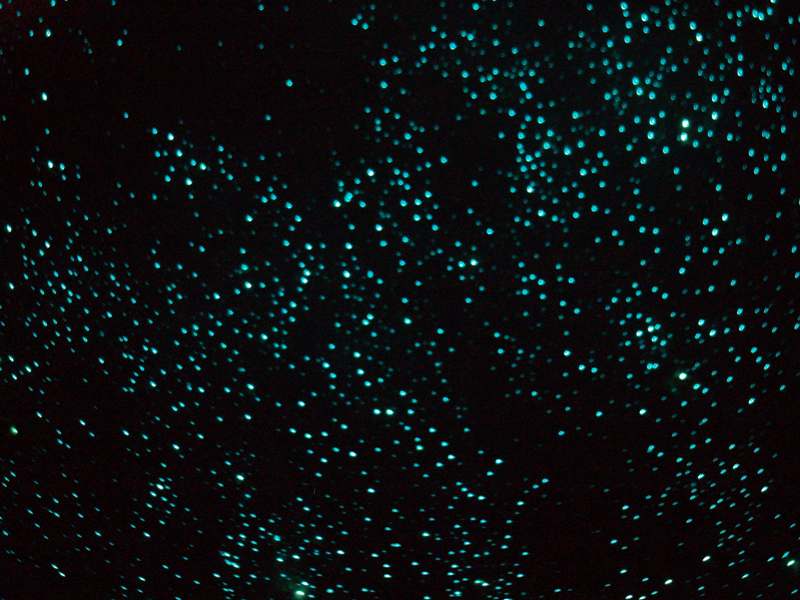
Figure 7. An example glowworm photograph prior to stitching
Photo analysis
The stitched photograph is analysed using a program called “Image J”. Image J is public domain software for analysing images. Image J counts all glowworm lights above a user selected size threshold e.g. all particles/lights larger than 4 adjoining pixels. Thresholds can also be set to remove camera pixilation noise from analyses. Noise varies with different exposure settings so experimentation was required to determine the best threshold setting for each exposure. Exposure was later standardised at 60 seconds.
Future glowworm monitoring work
More work is required on the monitoring system. Some variables need to be investigated, such as whether all glowworms are glowing when monitoring is done, or whether the camera is picking up smaller glowworms. Current work by Dave Merritt shows that the number of glowworms glowing and light intensities vary at different times of the day so this needs to be taken into account. Future work will endeavour to validate photographic counts by comparing lights numbers to physical light counts and actual glowworm counts.
References
de Freitas, C. R., Littlejohn, R. N., Clarkson. T. S. & Kristament, I. S. (1982) Cave Climate: Assessment of Airflow and Ventilation. Journal of Climatology (2) 383-297.
Acknowledgement: Dr Dave Merritt of the University of Queensland has helped considerably with developing photoanalysis protocols.