INTRODUCTION
Karsts developed in Cenozoic limestones and Palaeozoic marbles are found in many locations in NW South Island (Fig. 1). They are mainly, but not exclusively, located within the boundaries of three National Parks: the Abel Tasman NP, Kahurangi NP and Paparoa NP. A general background to the geomorphology and hydrology of New Zealand karsts is available in Williams (1992, 2004a), but the present contribution will focus just on karsts found along the northern part of the west coast of South Island between Paturau and Punakaiki (Fig. 1). These karsts are developed on Oligocene to Miocene limestones and are mainly found below 450m in altitude, although in places extend below sea level. The west coast maritime environment in which these karsts are located is by nature a land of forests, being mild (mean temperature about 12.5°C) and wet in all seasons (yearly rainfall 1776 mm at Paturau and 2346 mm at Punakaiki, but increases inland to over 3000 mm). This is exactly the kind of situation in which chemical dissolution processes are at their most active and in which karst evolves most rapidly.
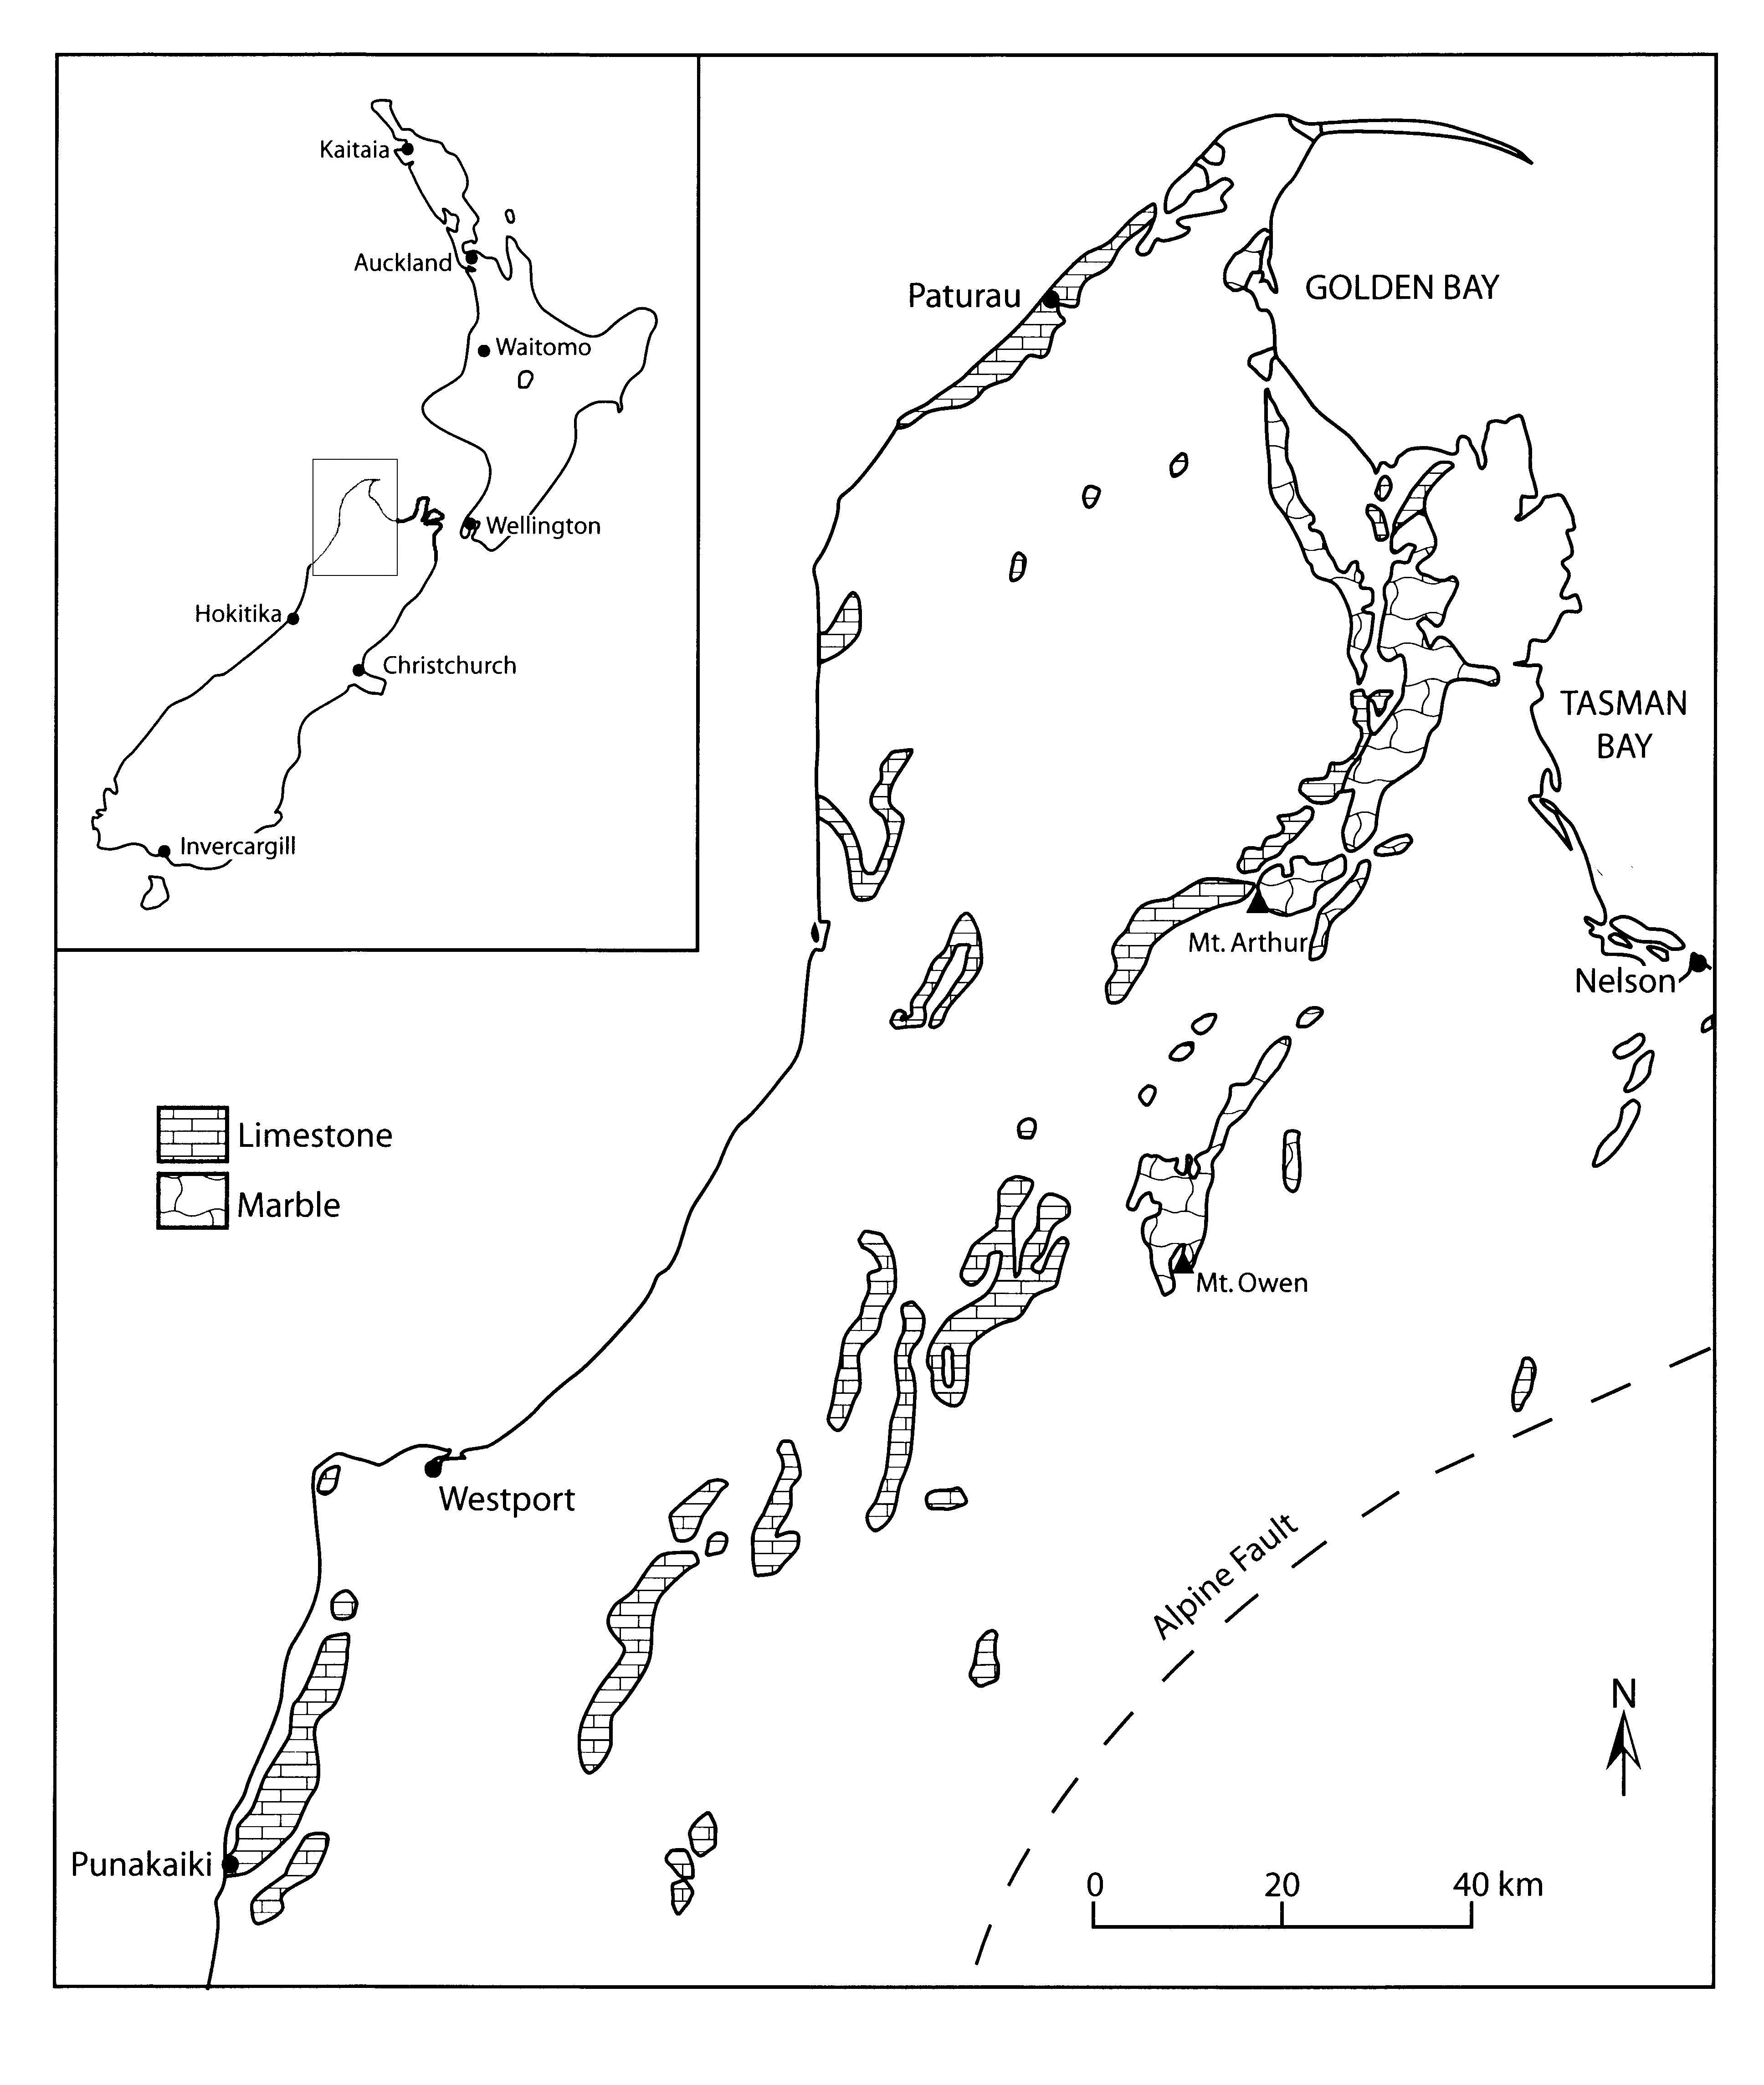
Figure 1. Karst rocks of northwest Nelson, South Island (from Williams 1992)
TECTONIC SETTING
To understand the history of these landscapes, we need first to consider their setting in the context of the tectonic evolution of the South Island and the development of the Southern Alps, details of which are available in Tippett and Kamp (1995) and Williams (2004b). New Zealand broke away from supercontinent of Gondwana in the Late Cretaceous, about 80 million years ago. By 60 million years ago the Tasman Sea had reached its full width and the originally mountainous landmass of New Zealand had been reduced to an archipelago of swampy islands near sea-level, the eroded products of which were deposited off-shore. Thus the rifted eastern margin of the Tasman Sea had accumulated considerable amounts of land-derived sediments, as well as thick carbonate marine sediments.
Convergence between the Pacific and Australian plates commenced in the Eocene and a plate boundary structure started to form through the country. By the early Miocene this had developed into a faulted strike-slip to convergent boundary now known as the Alpine Fault. Lateral offset on the fault was initiated around the start of the Miocene ca. 23 million years ago, although most of the movement has probably taken place in the last 10 million years. Approximately 460 km of dextral offset has occurred on-land along the Alpine Fault, as indicated by the similarity of rocks in northwest Nelson to those in Fiordland on opposite sides of the plate boundary. Rocks in northwest Nelson that are similar to those found in Fiordland include the Ordovician sequences that contain the Arthur Marble of Mts Owen (1875 m) and Arthur (1778 m).
The phase of mountain building that initiated the convergence of the Pacific and Australian plates is known as the Kaikoura Orogeny. It continues to this day and appears to be accelerating. Uplift started at different times across the country and resulted in the emergence of the marine carbonate sequences that had accumulated in the Oligocene to Miocene. Where it started earliest and was at its most vigorous, five to ten million years of erosion led to complete denudation of the uplifted Cenozoic sediments, resulting in the exhumation of the underlying Late Cretaceous erosion surface (which has been tilted and deformed by uplift). But on the flanks of the emerging mountains uplift was later and less rapid, and so large patches of Cenozoic sediments still remain, including limestones, sandstones and coal measures. This is the situation along the west coast of South Island. In some places remnant hillocks of limestones can be seen on the ancient erosion surface, as on the Gouland Downs, and the contact between the limestones and the underlying erosion surface can sometimes be observed in caves, as in Honeycomb Hill Cave and the Oparara Arch north of Westport.
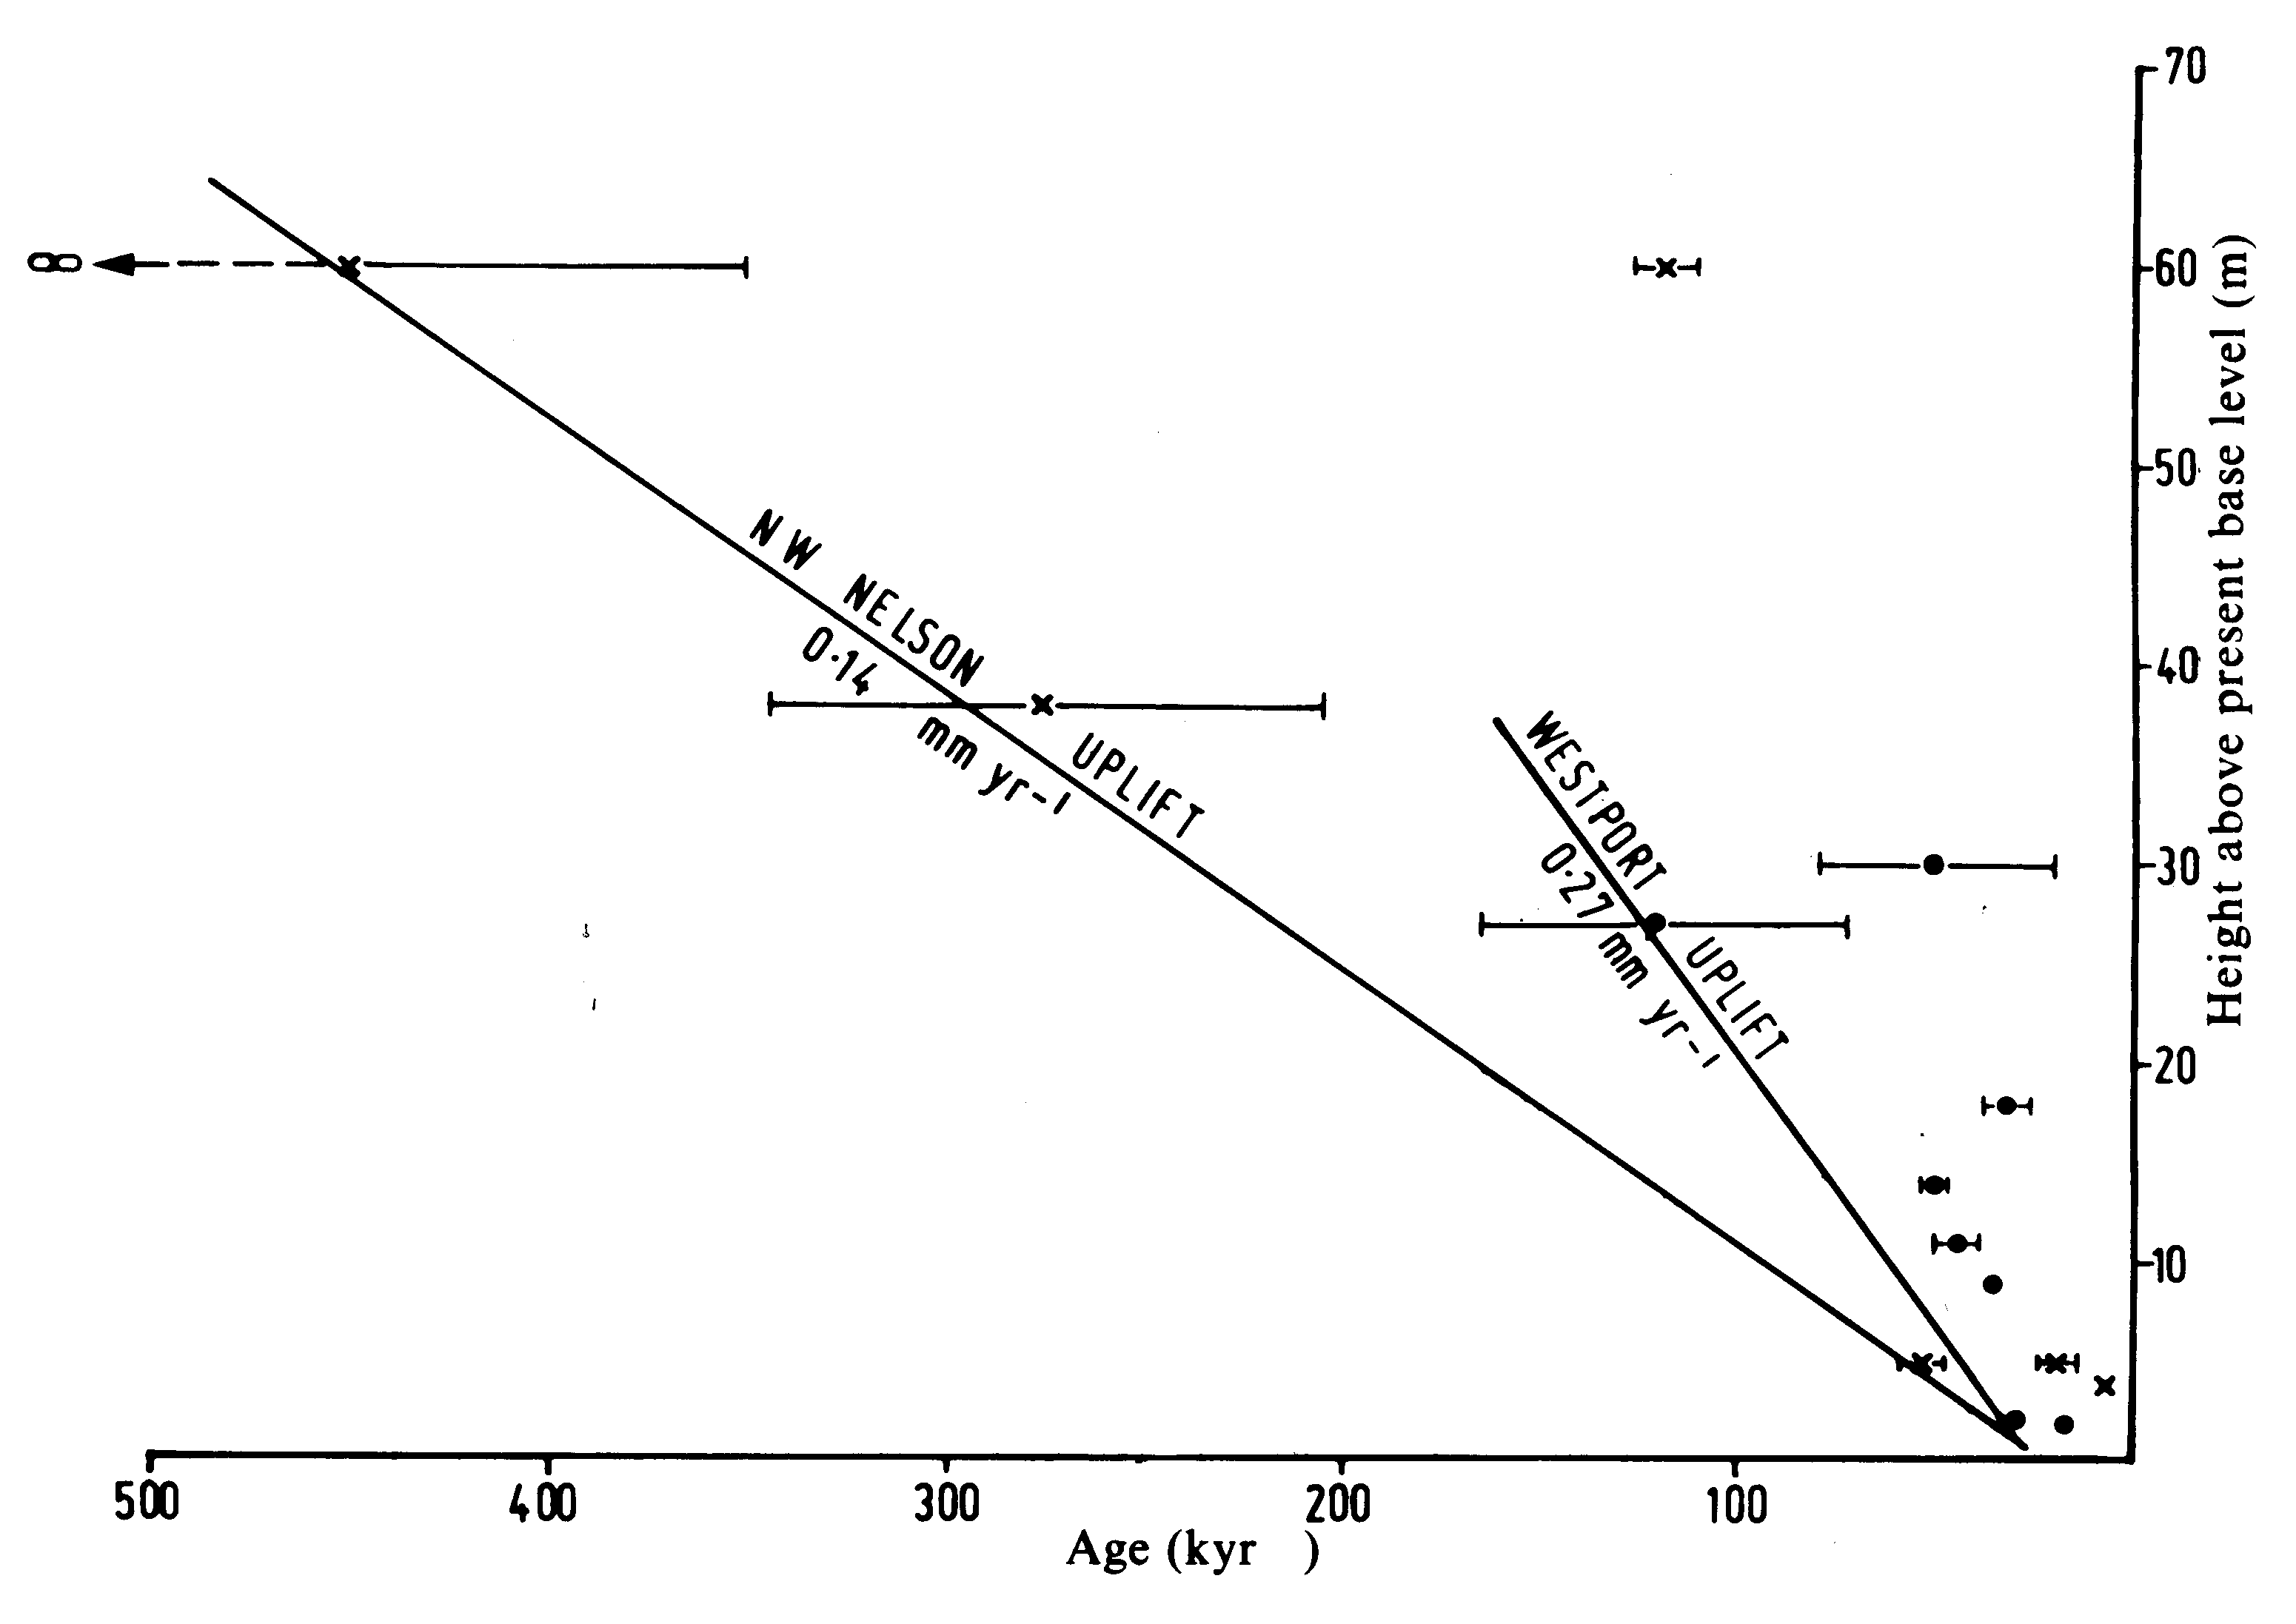
Figure 2. Plots of speleothem age against their elevation above modern sea level for cave sites near Westport and NW Nelson (from Williams 1982). The speleothem dates are U/Th ages by alpha counting with horizontal bars showing 1s errors. The NW Nelson curve has since been found to be less steep, i.e. uplift rates are <0.1 mm/year.
RATES OF UPLIFT
Rock uplift has been greatest in the area immediately adjacent to the Alpine Fault. It has undergone long-term (since about 7 million years ago) uplift of 1 - 2.7 mm per year, with shorter-term (since 1.3 million years ago) rates of 6 - 10 mm per year (Tippett and Kamp 1995). Recent rates of uplift along the west coast are much less than this, as determined from dating the relationships of cave levels to coastal terraces. At any given level in a cave, the oldest speleothems could only have been deposited when the stream that formed the passage abandoned it. Hence an envelop curve that encloses a series of speleothem ages at different heights indicates the rate of water-table lowering in the cave (Fig. 2). The rate of cave stream incision is determined by at least two factors: (1) the erosive power of the stream (sum of mechanical and chemical erosion) and (2) the rate of uplift of the land (which increases potential energy). If the erosive power of the stream is high, the rate of water-table lowering can equal the rate of uplift. This has probably been the case for the sites investigated. In Metro Cave near Charleston the rate of downcutting of the cave stream has averaged about 0.27m per thousand years and in Wet Neck Cave near Paturau it is about half that (Williams 1982). The uplift rate is higher inland towards the Alpine Fault, as indicated by a rate of water-table lowering of ~0.44m per thousand years in Nettlebed Cave beneath Mt Arthur. The evidence of differential uplift indicates tilting towards the northwest.
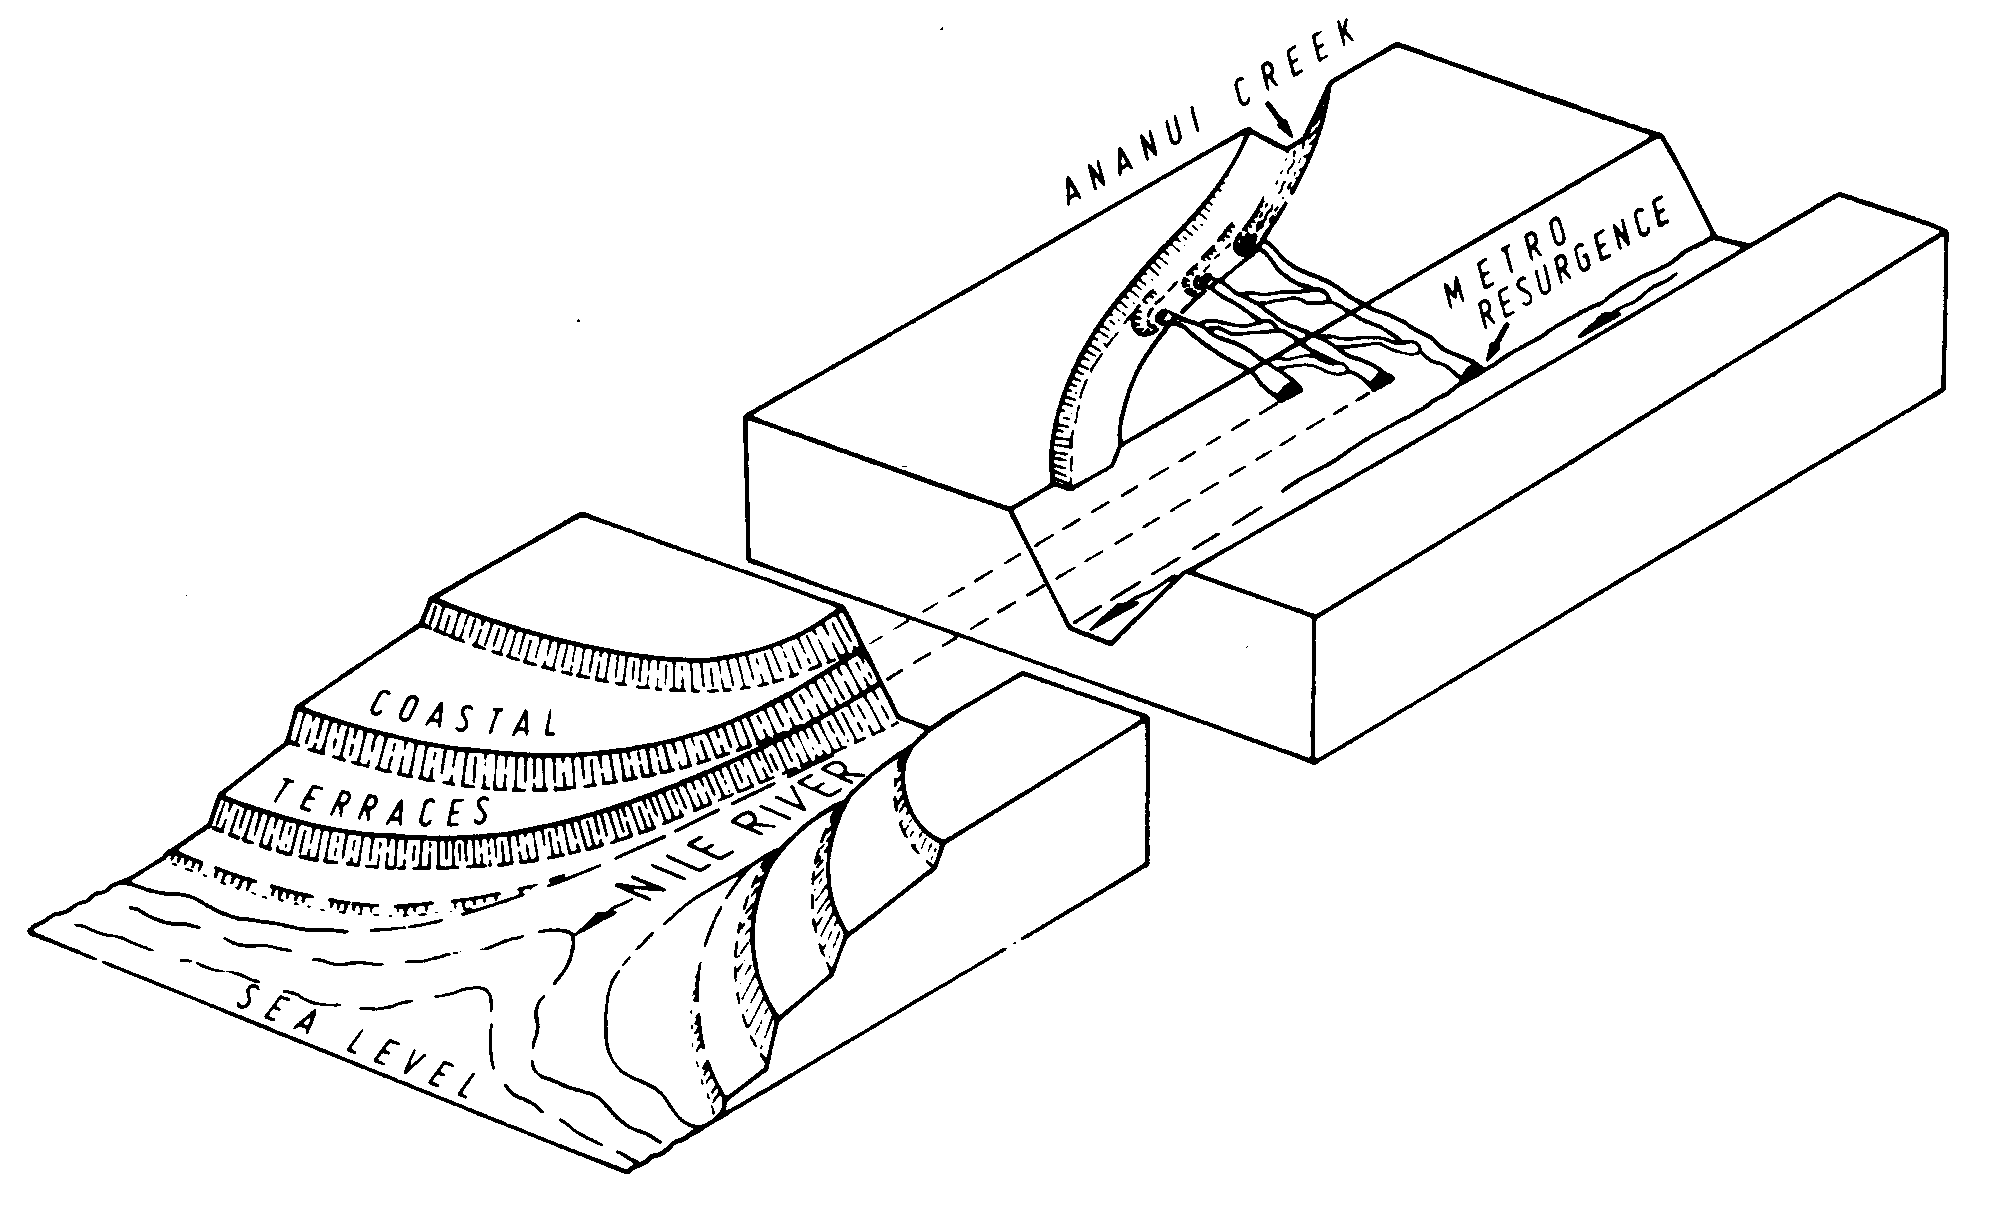
Figure 3. A sketch to show the relationship between passage levels in Metro (Ananui) Cave and coastal terraces near Charleston (from Williams 1982). Ananui Creek that flows through the cave is a tributary of the Waitakere (Nile) River. Evidence in the cave shows that stream incision has been interrupted from time-to-time by aggradation of river gravel. This was probably related to glacial phases of the Pleistocene when gravel production in the headwaters was increased.
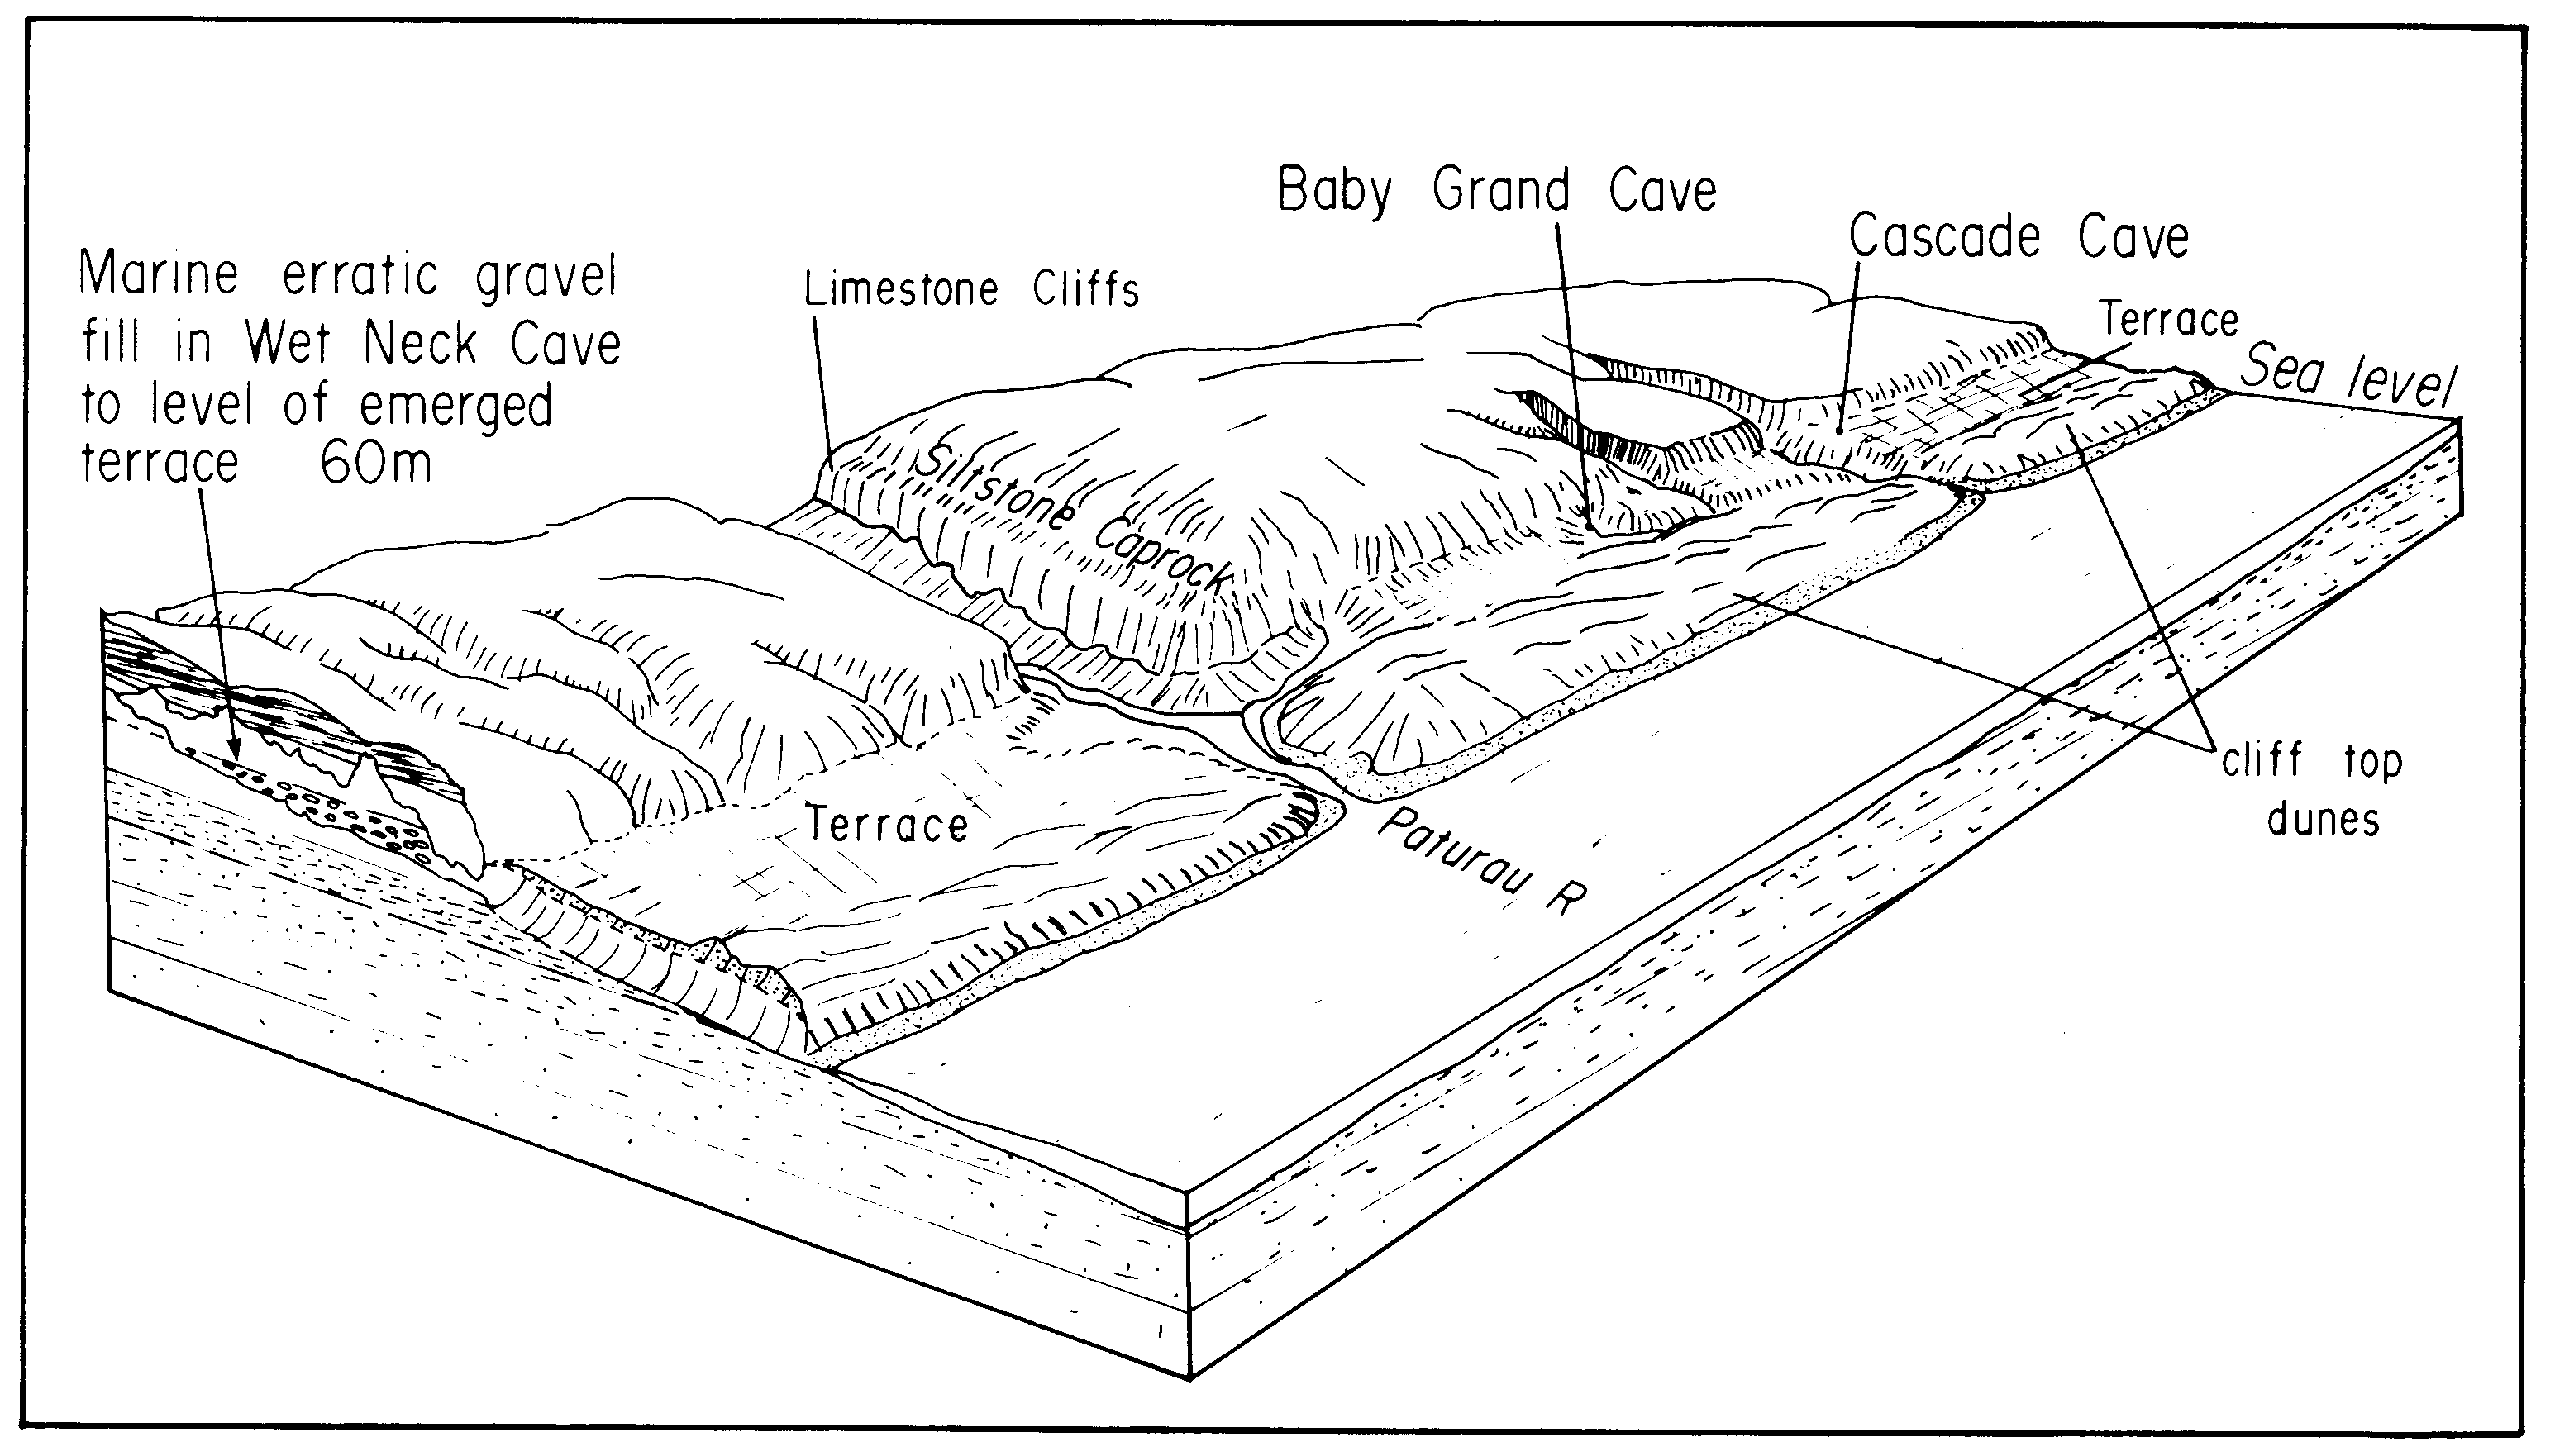
Figure 4. A sketch of the relationship of caves to emerged marine terrace level at Paturau in NW Nelson (from Williams 1978).
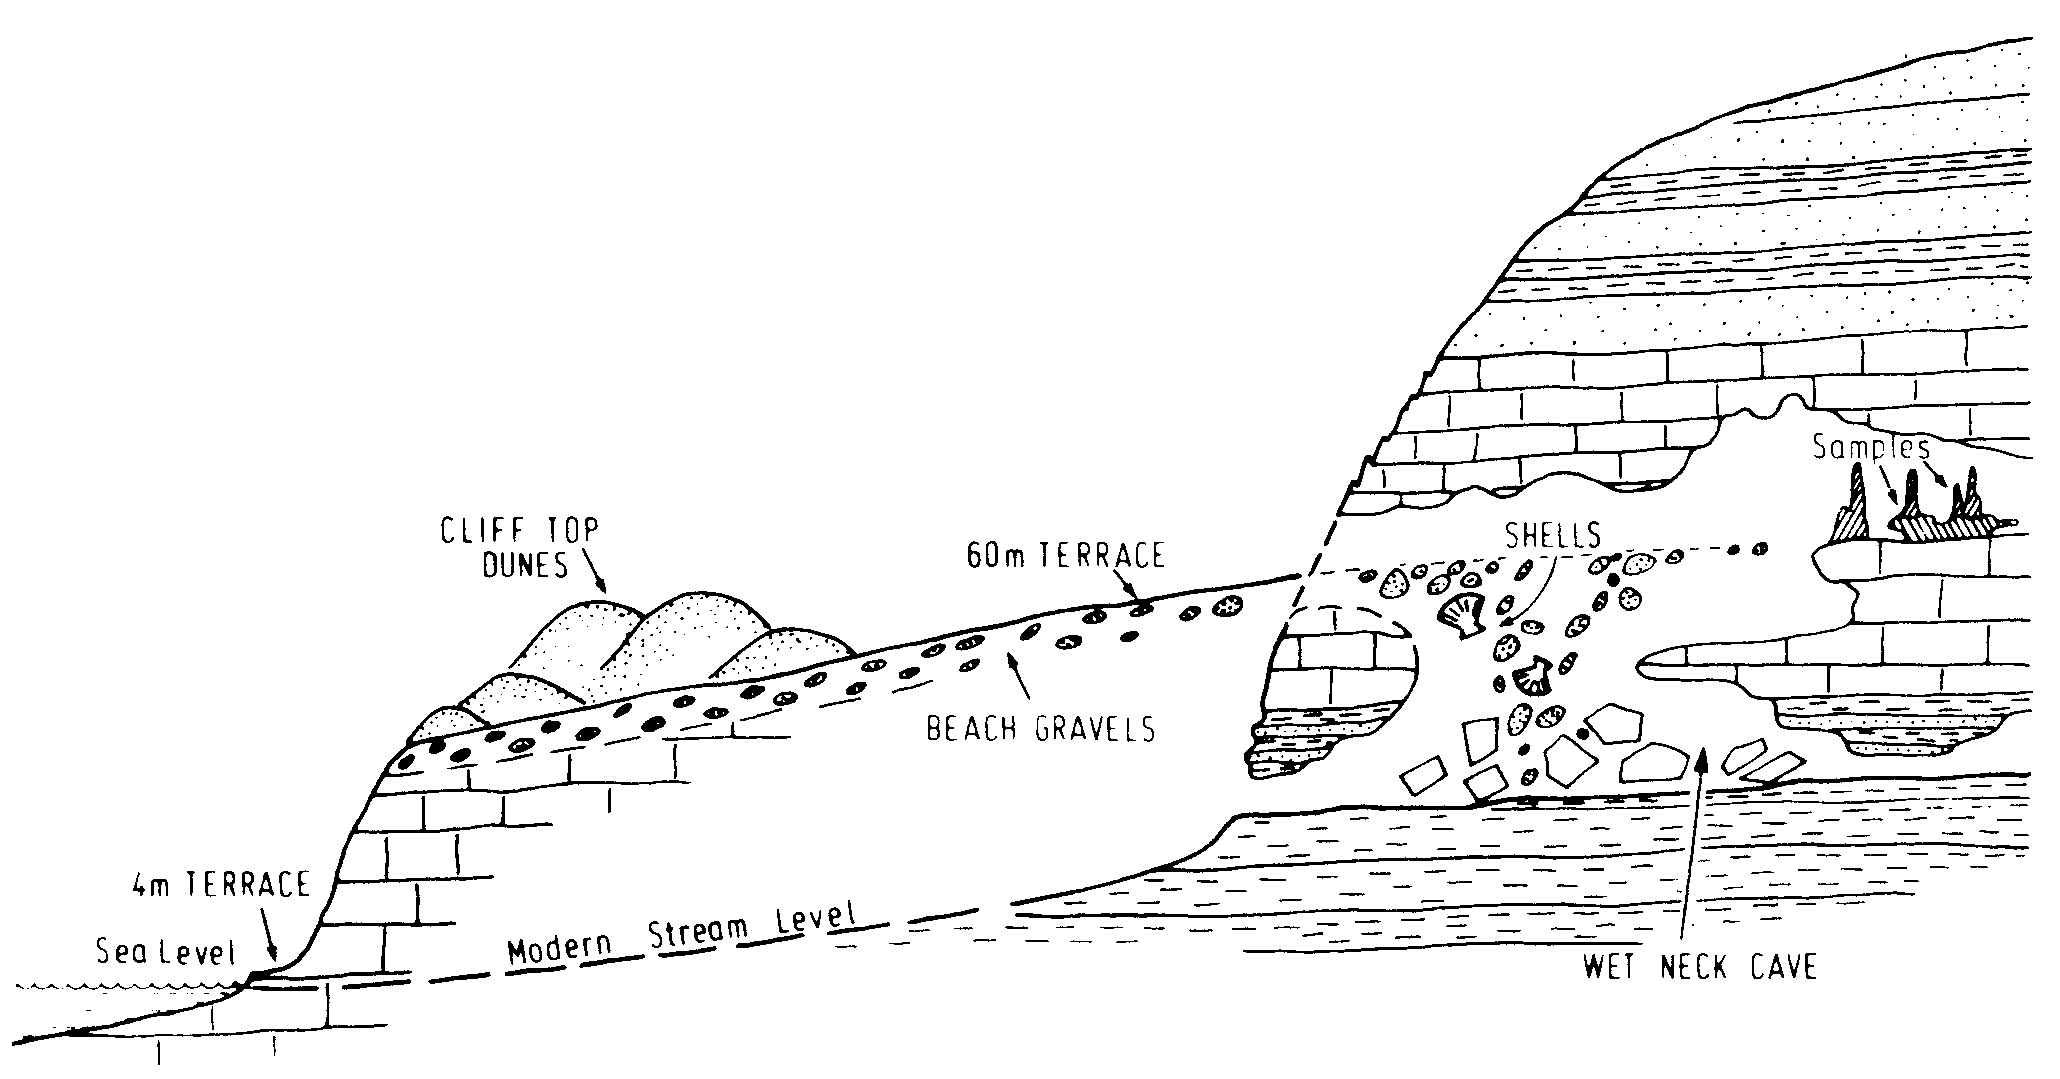
Figure 5. Relationship of marine deposits in Wet Neck Cave to the 60m emerged marine terrace. Quartz beach gravels from Wet Neck have been cosmogenically dated (by Derek Fabel at the ANU) to 800 ± 400 thousand years old and many speleothems exceed the limit of uranium series dating (~500 000 years). So the cave is likely to be about a million years old.
Coastal terraces that give evidence of the relative movement of land and sea are especially well developed north of Charleston where they can be related to stages in the downcutting of passages in Metro Cave (Fig. 3). Coastal terraces are also well developed further north around Karamea and Paturau (Fig. 4). Marine gravels and shells that form an extension of the 60m terrace at Paturau extend right into Wet Neck Cave (Fig. 5), indicating that the cave was in existence prior to its invasion by the sea, probably more than 800 000 years ago. When the sea was at the level of the terrace, the karst hills around Paturau would have been a series of islands. This was probably also the case for the limestone hills near Charleston and Punakaiki, when the sea stood at the level of the highest coastal terraces.
KARST ALONG THE NORTHWEST COAST OF THE SOUTH ISLAND
Limestones of Oligocene to earliest Miocene age occur as a discontinuous strip for over 250km along the northwest coast of the South Island and are particularly extensive in the area between Charleston and Punakaiki (Fig. 6). In various places patches are also found further inland where they have sometimes been uplifted to 1000-1500m, for example in The Haystack and Thousand Acre Plateau of the Matiri Range north of the Buller Gorge. The limestones are very variable in thickness and in lithology, from thin and sandy to thick and crystalline. In the Paturau district of the northwest coast, the Takaka Limestone is 25-50m thick, whereas at its type section at Tarakohe in Golden Bay it is 80m thick but sandy in its lower half (Bishop 1971).
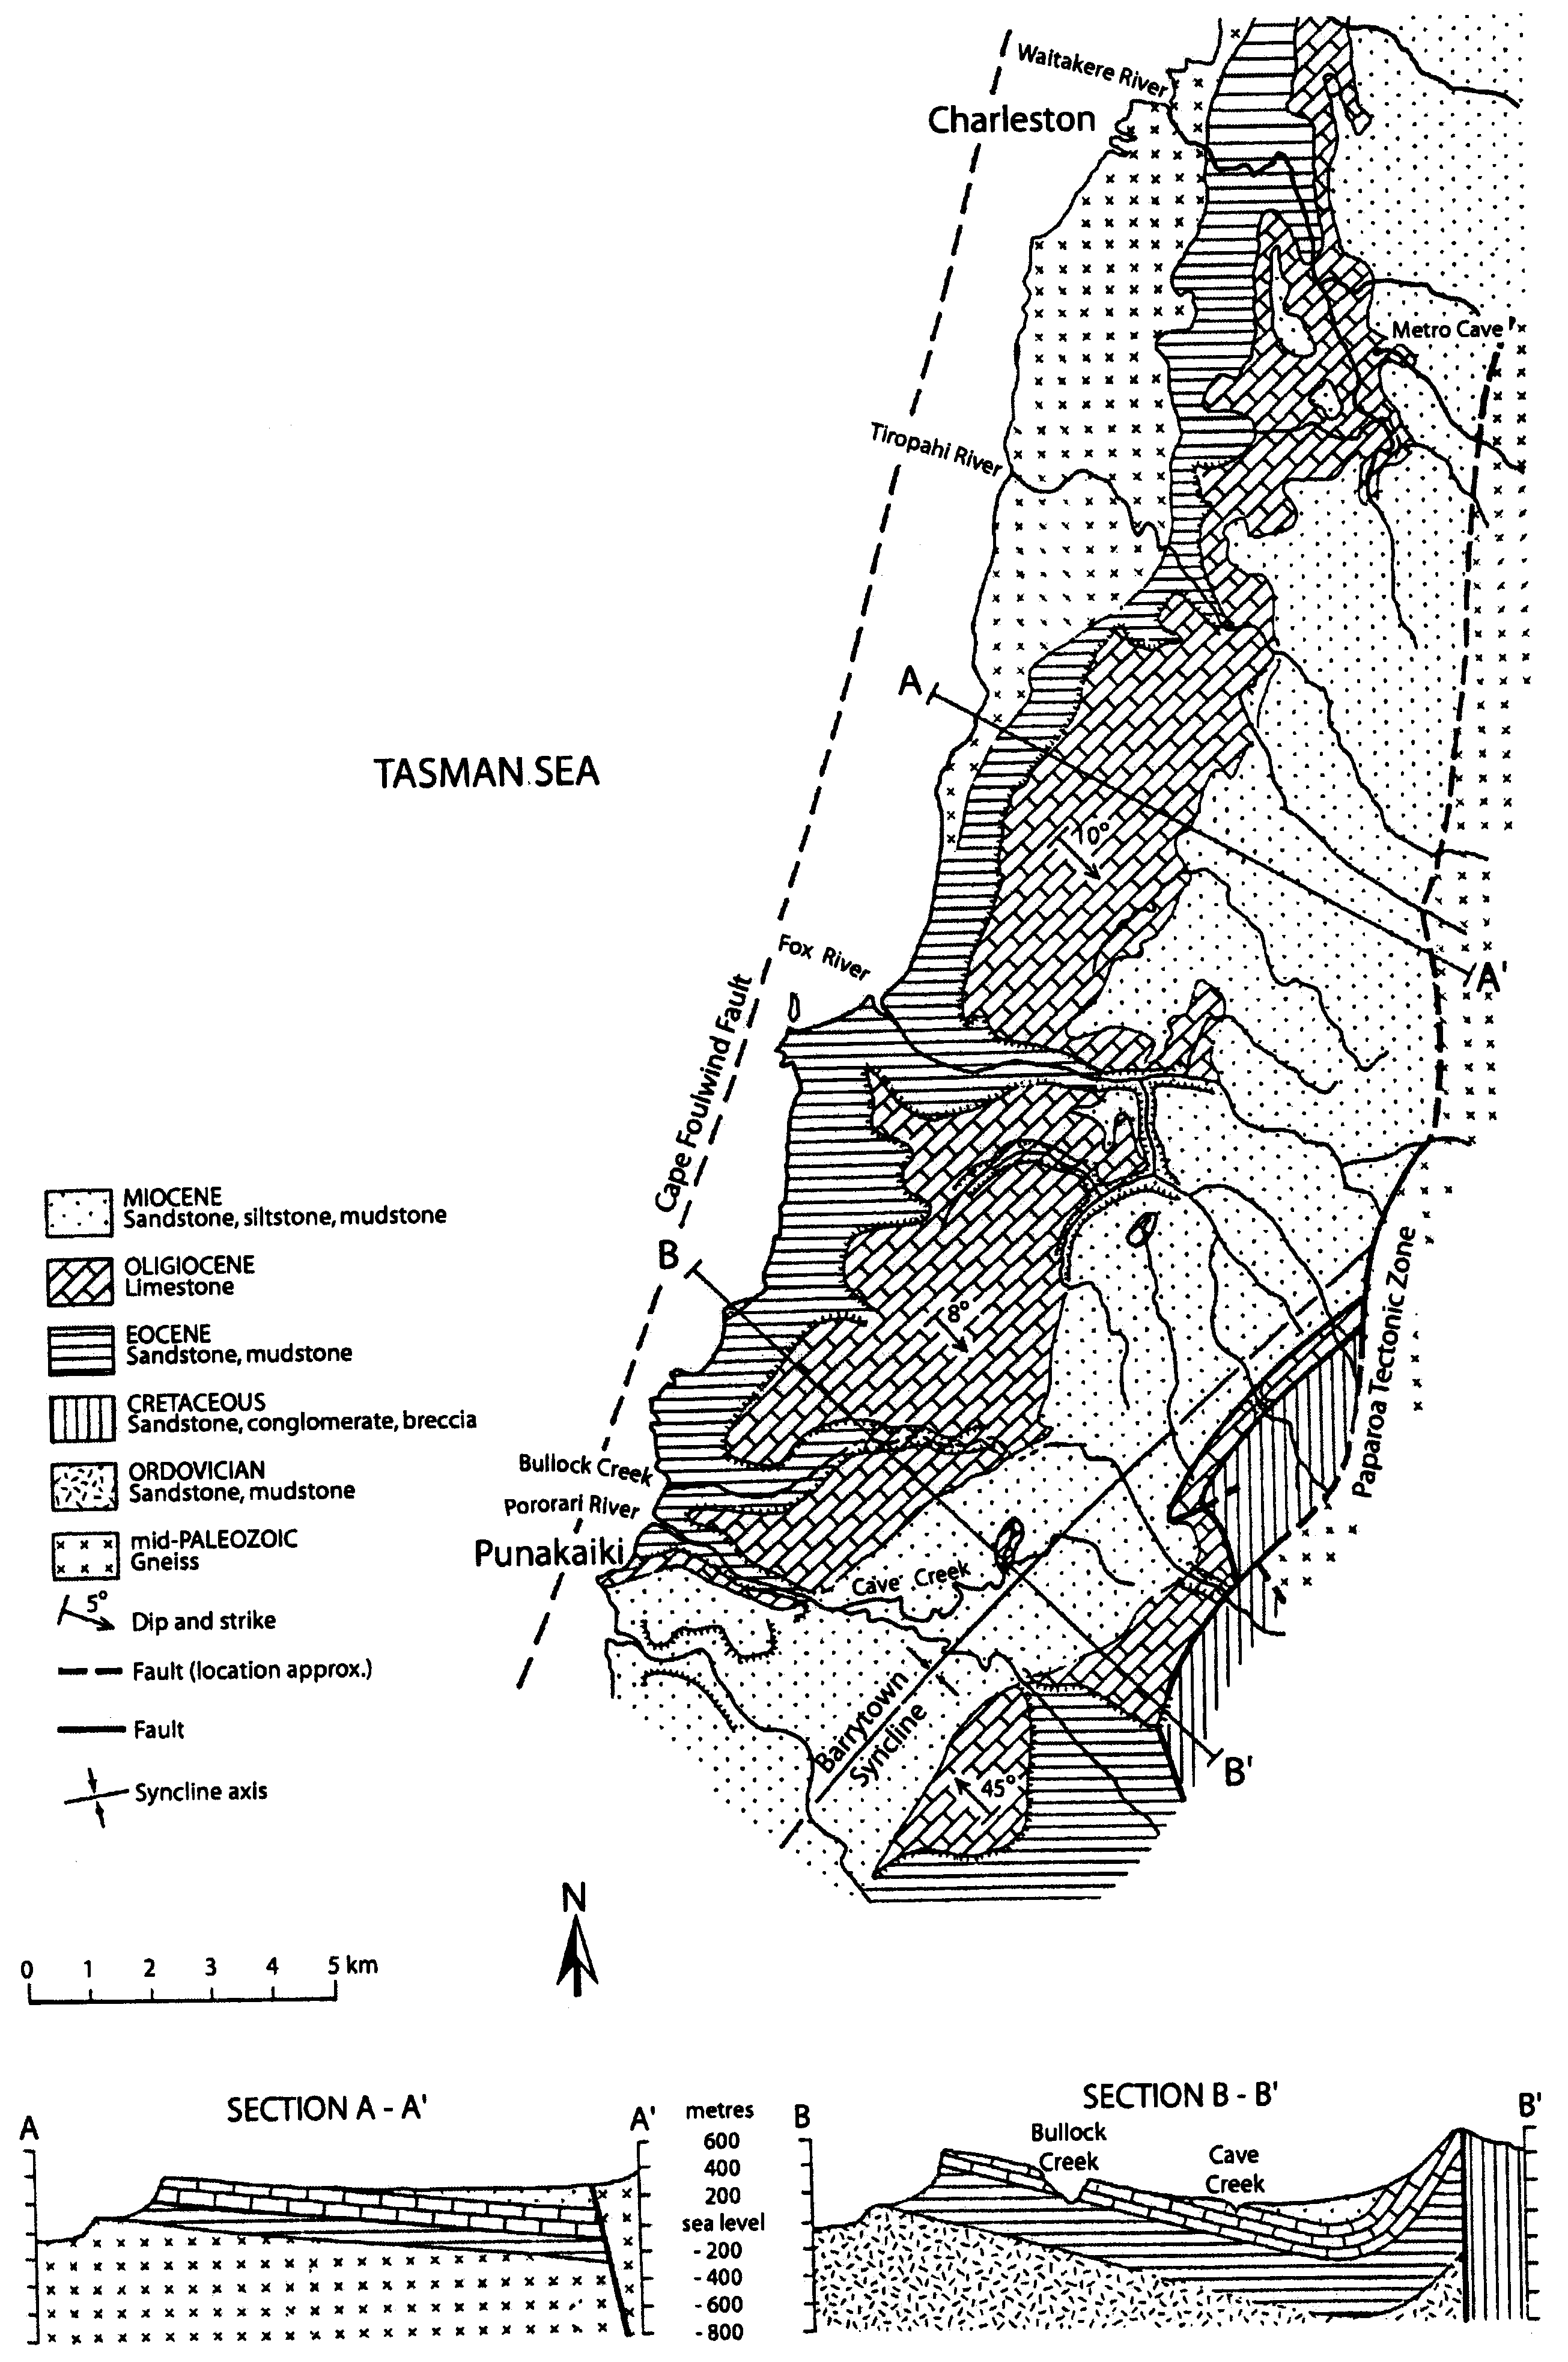
Figure 6. Limestone occurrences between Charleston and Punakaiki (modified after Nathan 1975 and Laird 1988). Note that limestones underlie the Miocene clastic sediments of the Barrytown Syncline and that the limestone inlier exposed in Cave Creek indicates that there is extensive potential for interstratal karst development.
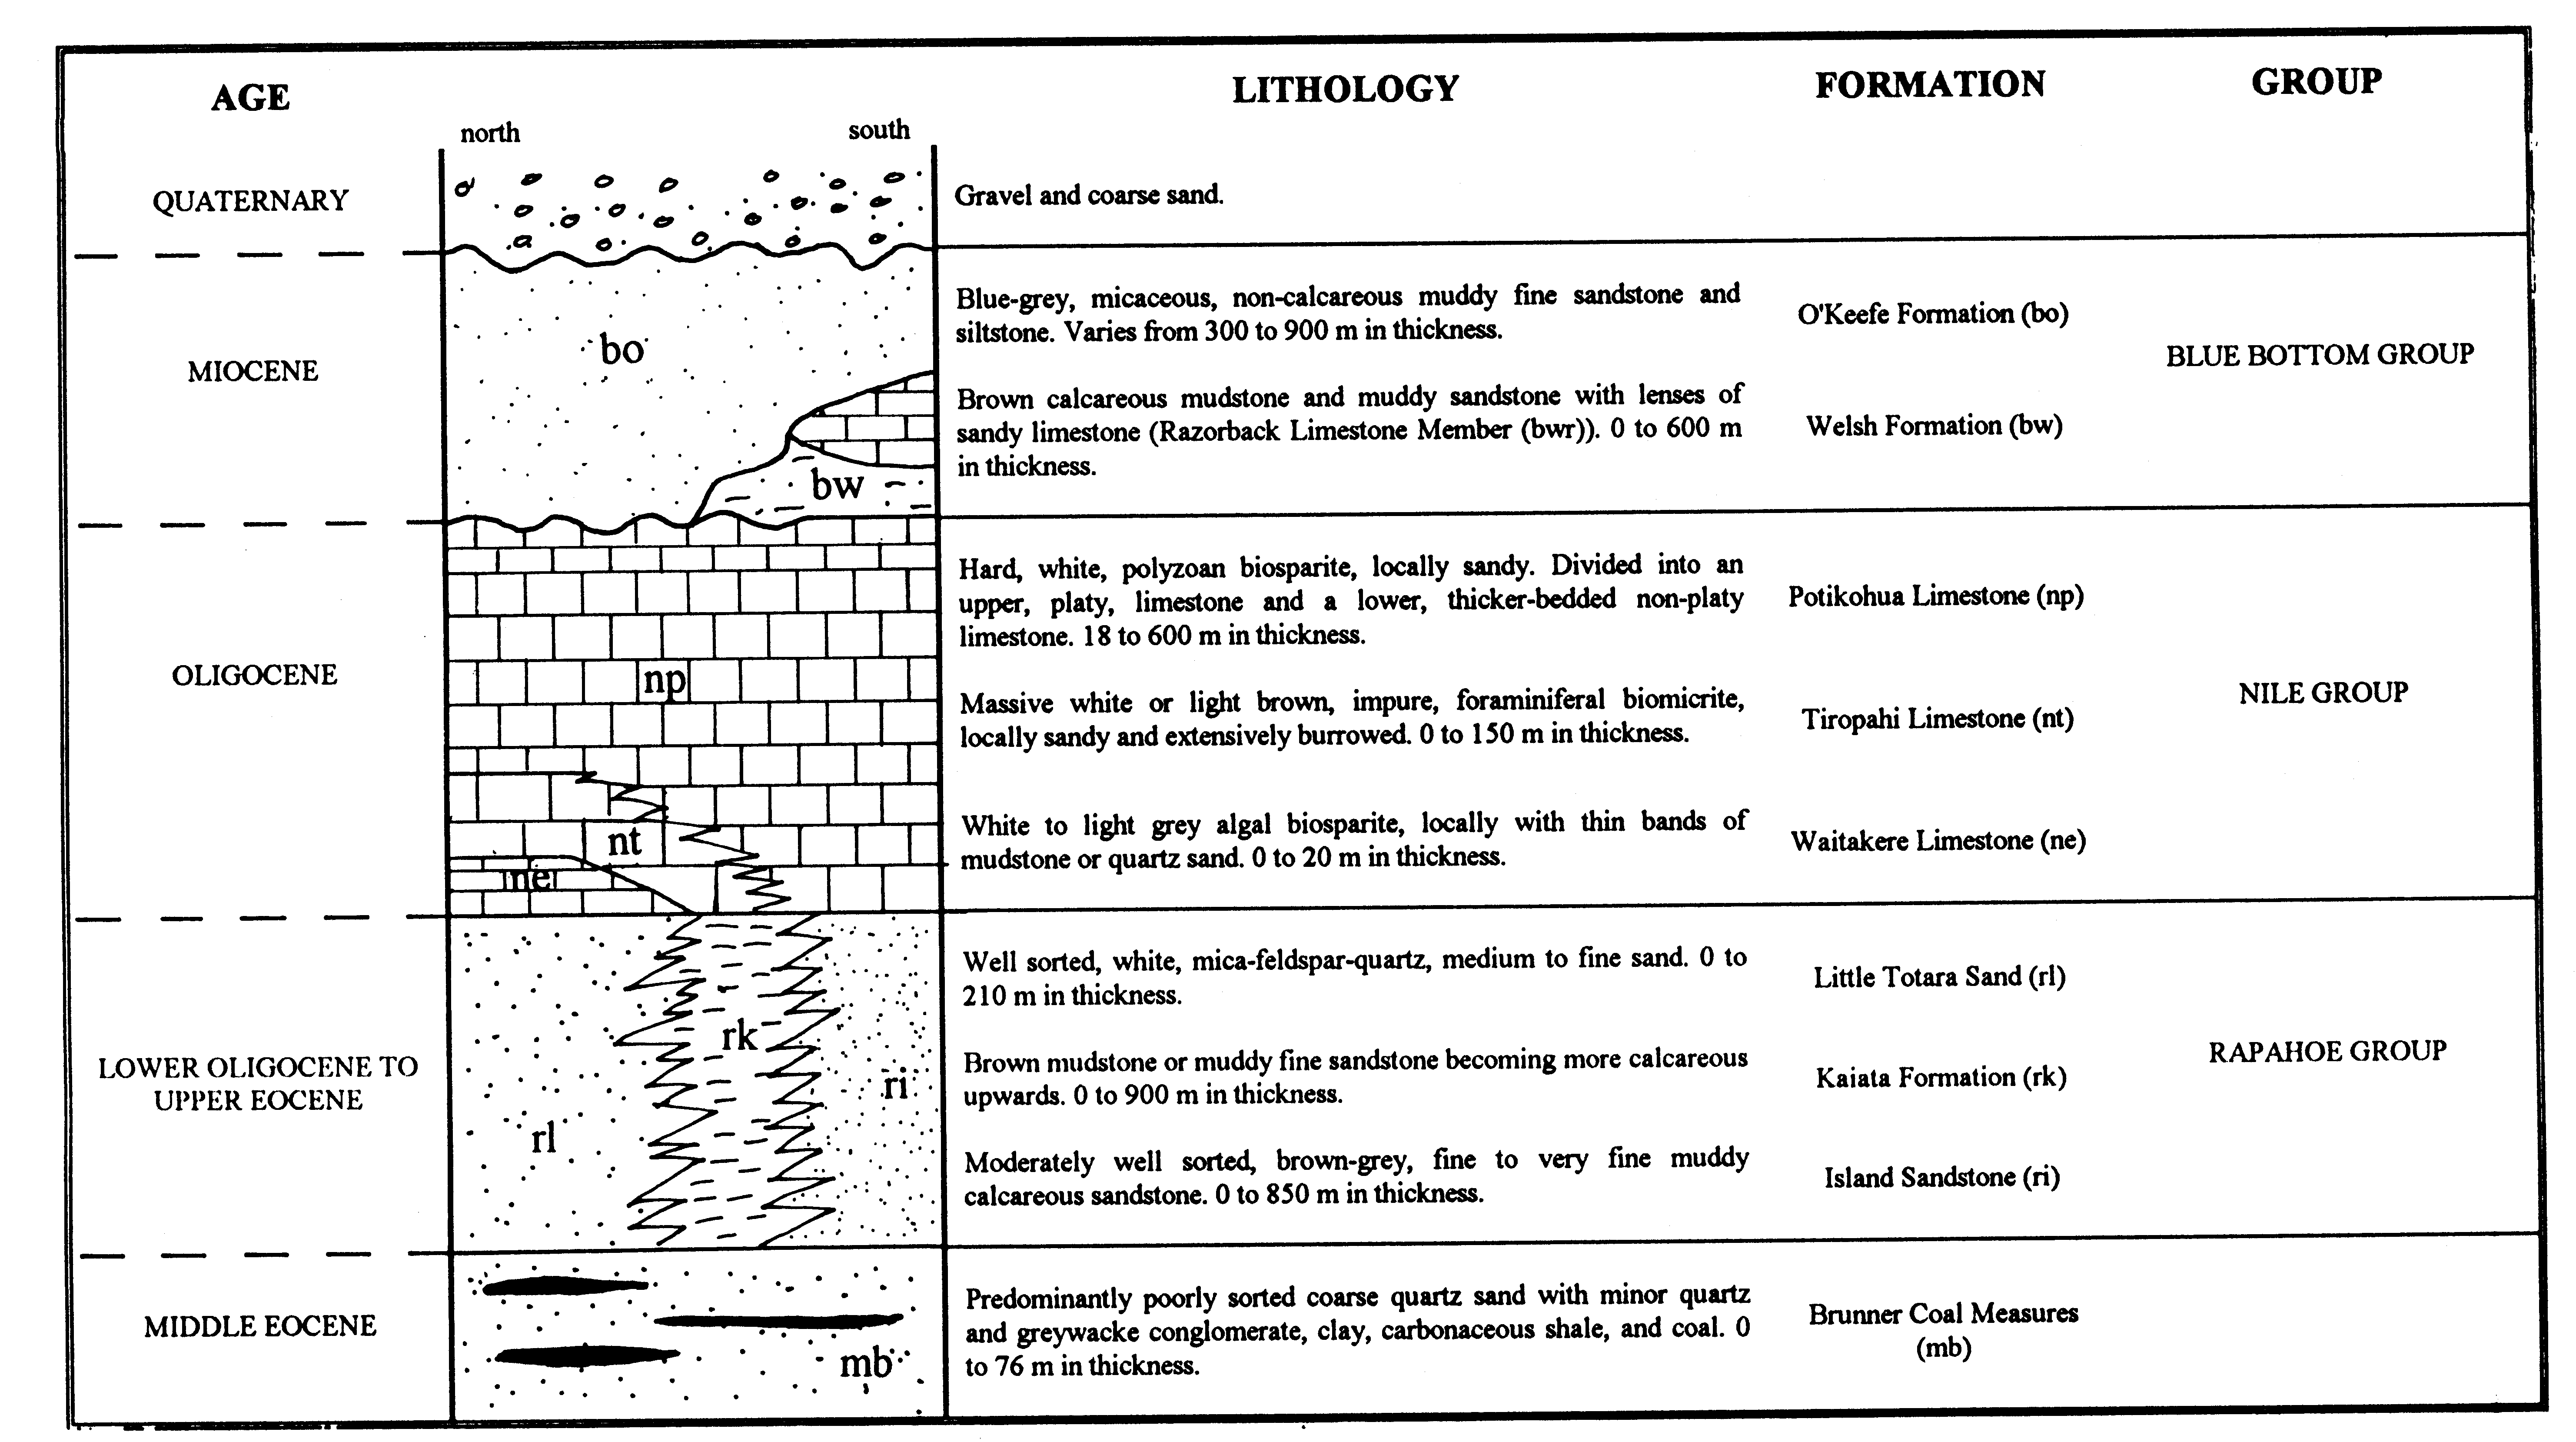
Figure 7. Generalised stratigraphic column (not to scale) for Cenozoic rocks of the Punakaiki to Charleston area (from Crawford 1994 after Nathan 1975 and Laird 1988).
Near Charleston and Punakaiki, the limestone sequence is highly variable in thickness, but in places exceeds 700m. It is divisible into the Waitakere Limestone, Tiropahi Limestone, and Potikohua Limestone (Fig. 7). The latter is particularly important for karst development, being a dense polyzoan biosparite. It is stylobedded and has a platy appearance in weathered outcrop, giving rise to the Pancake Rocks, where an uplifted Last Interglacial marine platform (now emerged to 34-36m above sea level) has been partly stripped of gravelly beach sediments by surf and spray. The flaggy layering appears related to the differential exploitation of insoluble clays and micas formed along stylolites by pressure solution (Laird 1988). Inland from the coast at Punakaiki, the limestones underlie a 400-300m plateau that is tilted inland and heavily dissected by solution dolines, giving rise to the southernmost extent of polygonal karst in New Zealand. Karst has developed from the dismemberment of surface streams on Miocene coverbeds as the underlying limestones were exposed. Dolines, karren, streamsinks, caves, springs and gorges are well developed.
If the present rate of uplift in the region gives us a guide to long-term landscape evolution in the Punakaiki-Charleston region, then the higher parts of the karst plateau probably began to emerge about 1- 1.5 million years ago.
Rivers from the Paparoa Range maintained their courses to the sea as uplift occurred, thereby producing antecedent gorges that are characteristic of the region. Subterranean streams tributary to these gorges produced caves such as Babylon and Metro (Ananui). Dry cave passages at 150m or more above modern river level are likely to be at least 500 000 years old. However, throughout the Quaternary sea level also varied over a range of at least 120m. Thus rivers incised to lower levels during low-stands of the sea, but their coastal reaches were backflooded and sedimented during high-stands, when coastal terraces also formed. These terraces were subsequently uplifted, as has been the case at the Pancake Rocks where the original beach gravel cover is still being removed, but have been dissected by subsequent incision. The morphological effects of the oscillation of sea level when superimposed upon a steadily uplifting landmass has yielded a topography of terraces along the coast and up valleys and an underground landscape of caves with well developed levels that drain to antecedent gorges.
Karst hydrology in the region has been studied by Crawford (1994). The area contains an excellent example of underground river capture from Bullock Creek to Cave Creek (Fig. 8). Bullock Creek sinks at numerous points that extend in a downstream direction as discharge increases (Fig. 9), the combined capacity of the stream-sink zone being about 15-20 m3/s. The waters pass through the Xanadu Cave system and then re-emerge in a limestone inlier in Cave Creek gorge as a succession of overflow and underflow springs (Fig. 10). Their combined peak discharge is of the order of 30-40 m3/s, which indicates that the Bullock Creek losses are supplemented by about 30% extra water derived from other sources. The Cave Creek springs yield the largest flood flow from any karst system in New Zealand. During flood, the water table in the karst system can rise by up to 75 m, thus flooding most of Xanadu Cave.
The longitudinal profile of Bullock Creek contrasts markedly with the profiles of the neighbouring Fox and Pororari Rivers (Fig. 11). This is because there was a major landslide on the northern side of Bullock Creek valley that blocked the stream and trapped its sediment. The stream bed aggraded up-valley into the Barrytown synclinal trough (Fig. 6) at the western edge of which are the Bullock Creek streamsinks. The blockage encouraged Bullock Creek to drain southwards and develop Xanadu Cave, which has the typical passage branchwork of a floodwater maze cave. Speleothems from Xanadu range in age up to 44.2±5 ka BP and in Wazpretti Cave on the north side of Bullock Creek have been dated up to 81.2±4.1 ka BP (Crawford 1994). Crawford interpreted from this that the landslide dam was emplaced before the Xanadu speleothems were deposited some 45ka ago, but after the formation of Wazpretti Cave, which has been partly back-filled. The aggraded valley floor is now a large semi-enclosed depression, which overflows down Bullock Creek to the sea when the streamsinks are at their capacity. The depression resembles a border polje, but has a genetically different origin.
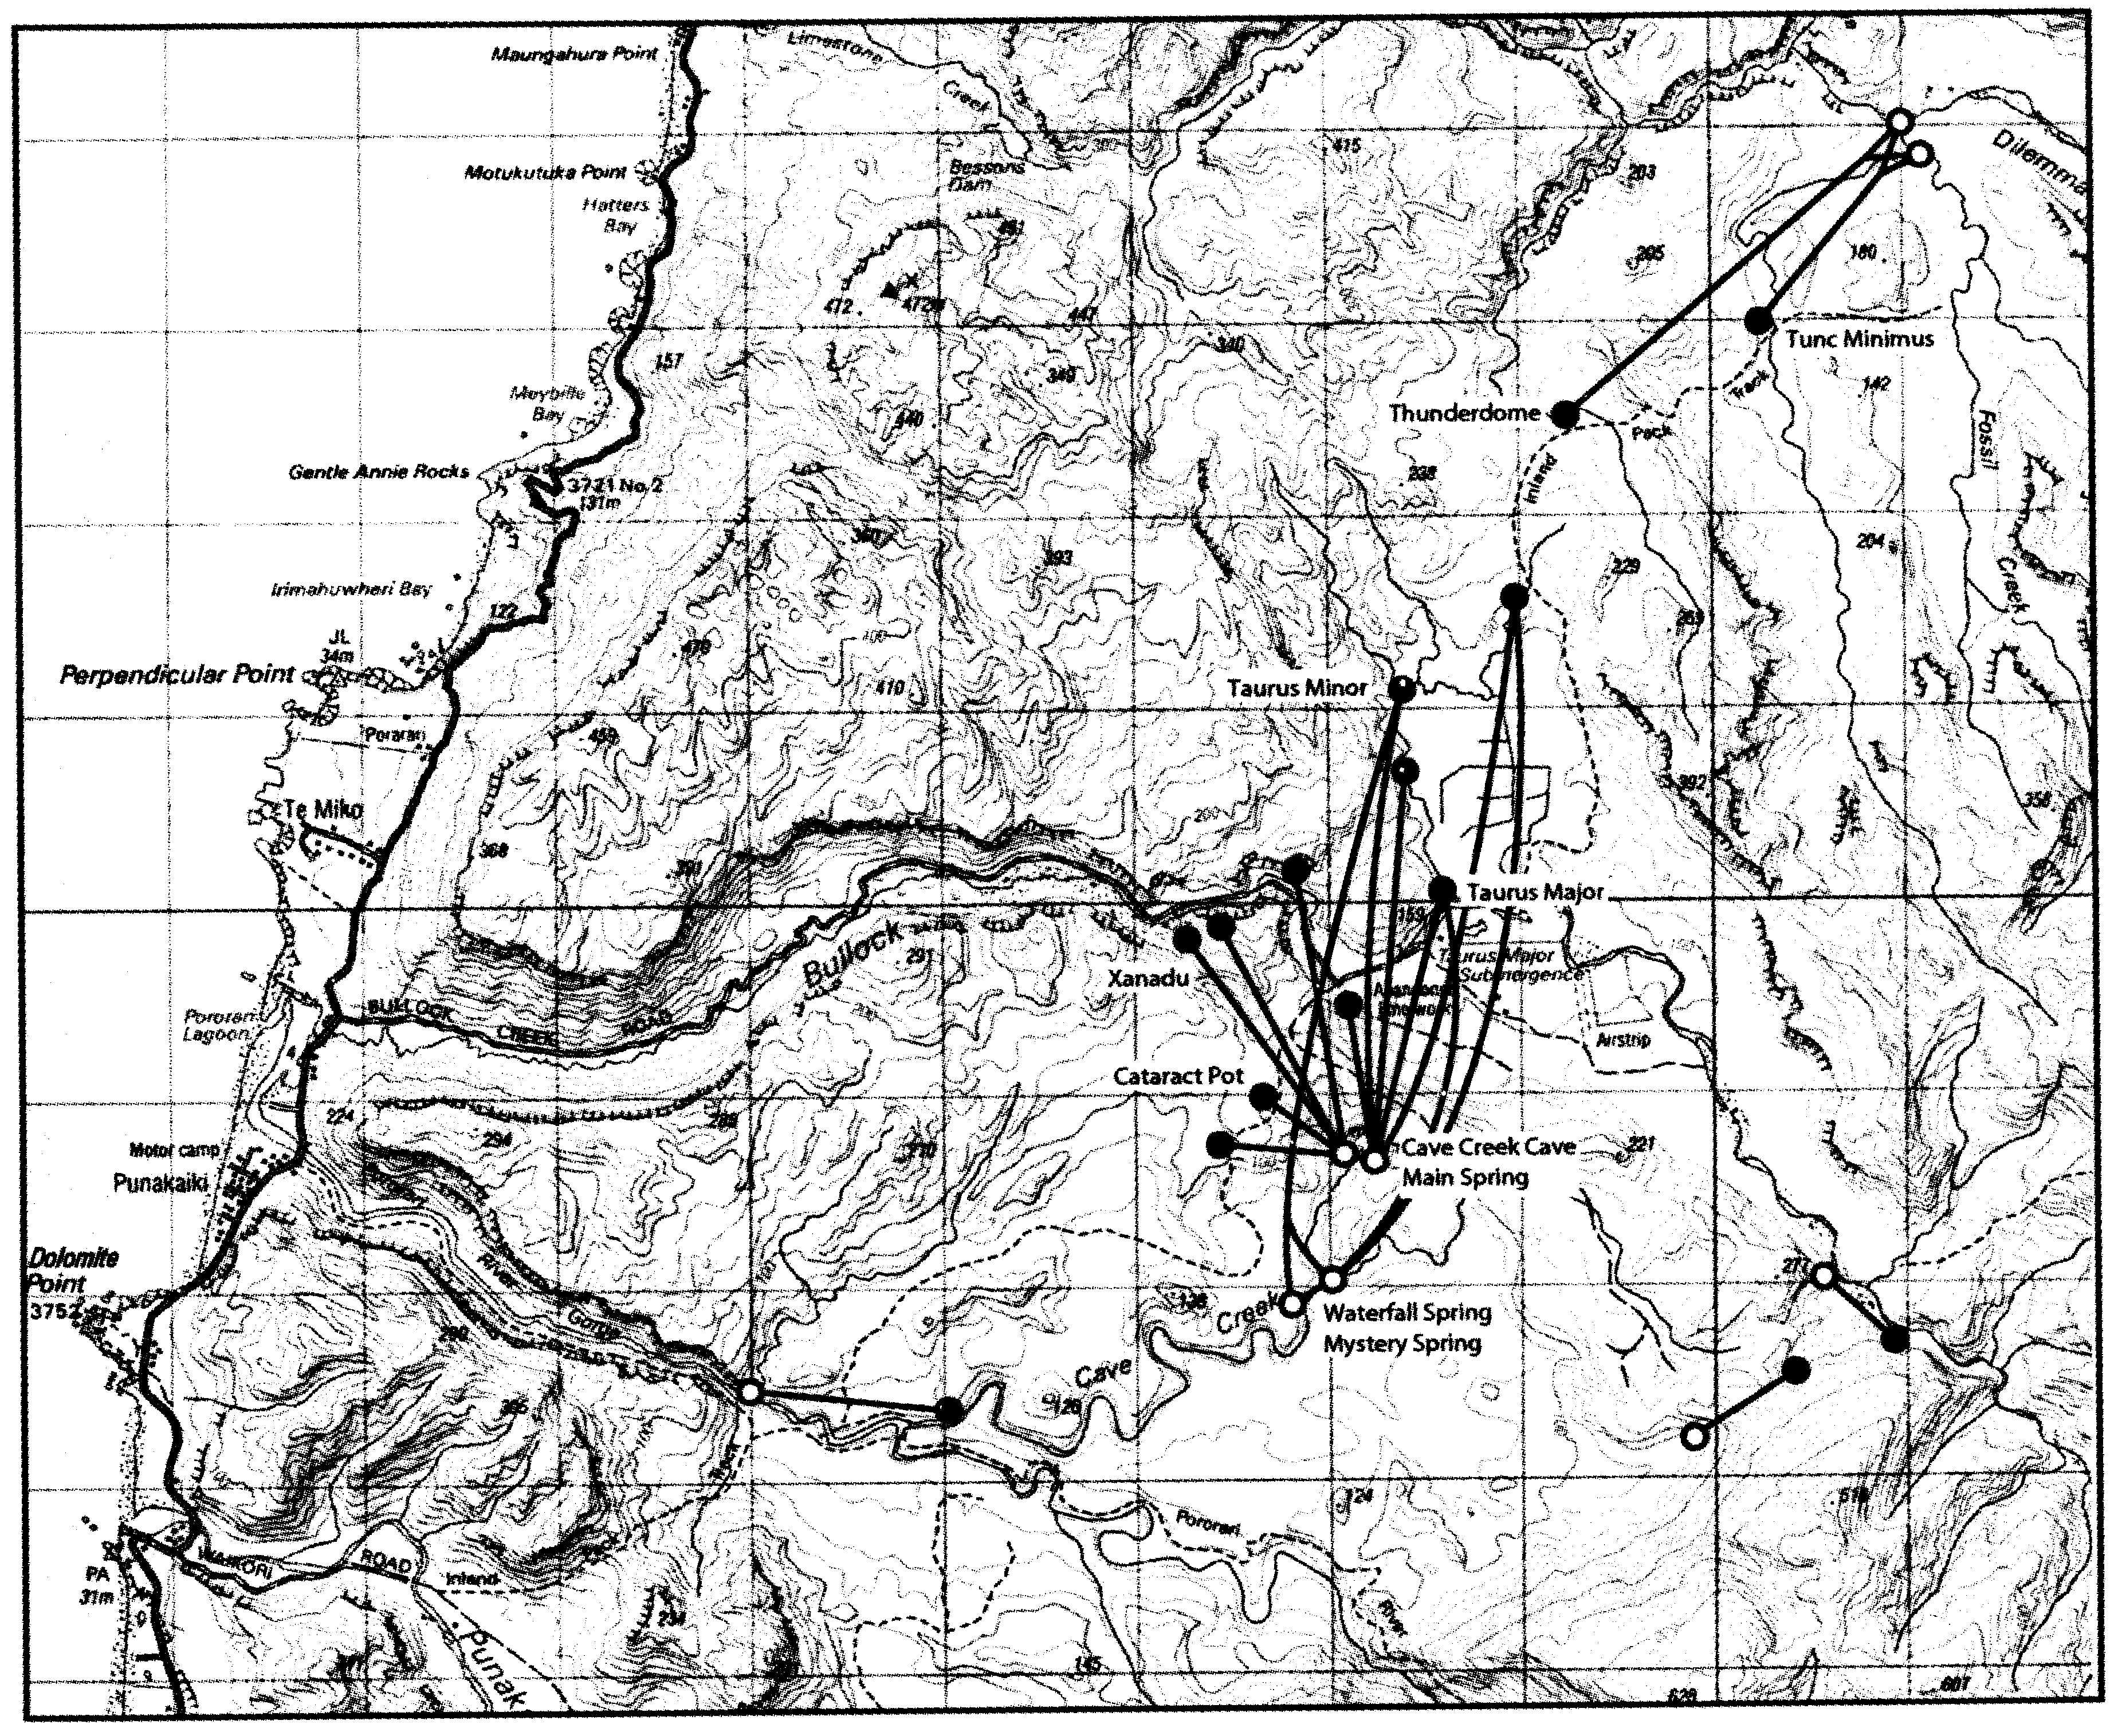
Figure 8. Subterranean drainage in the Bullock Creek area near Punakaiki (from Crawford 1994). The NNE-SSW orientation follows the direction of strike of the Barrytown Syncline. Sinking drainage from Bullock Creek emerges in Cave Creek, a tributary of the Pororari. A fluorescein dye test demonstrating this connection was first conducted in 1974.
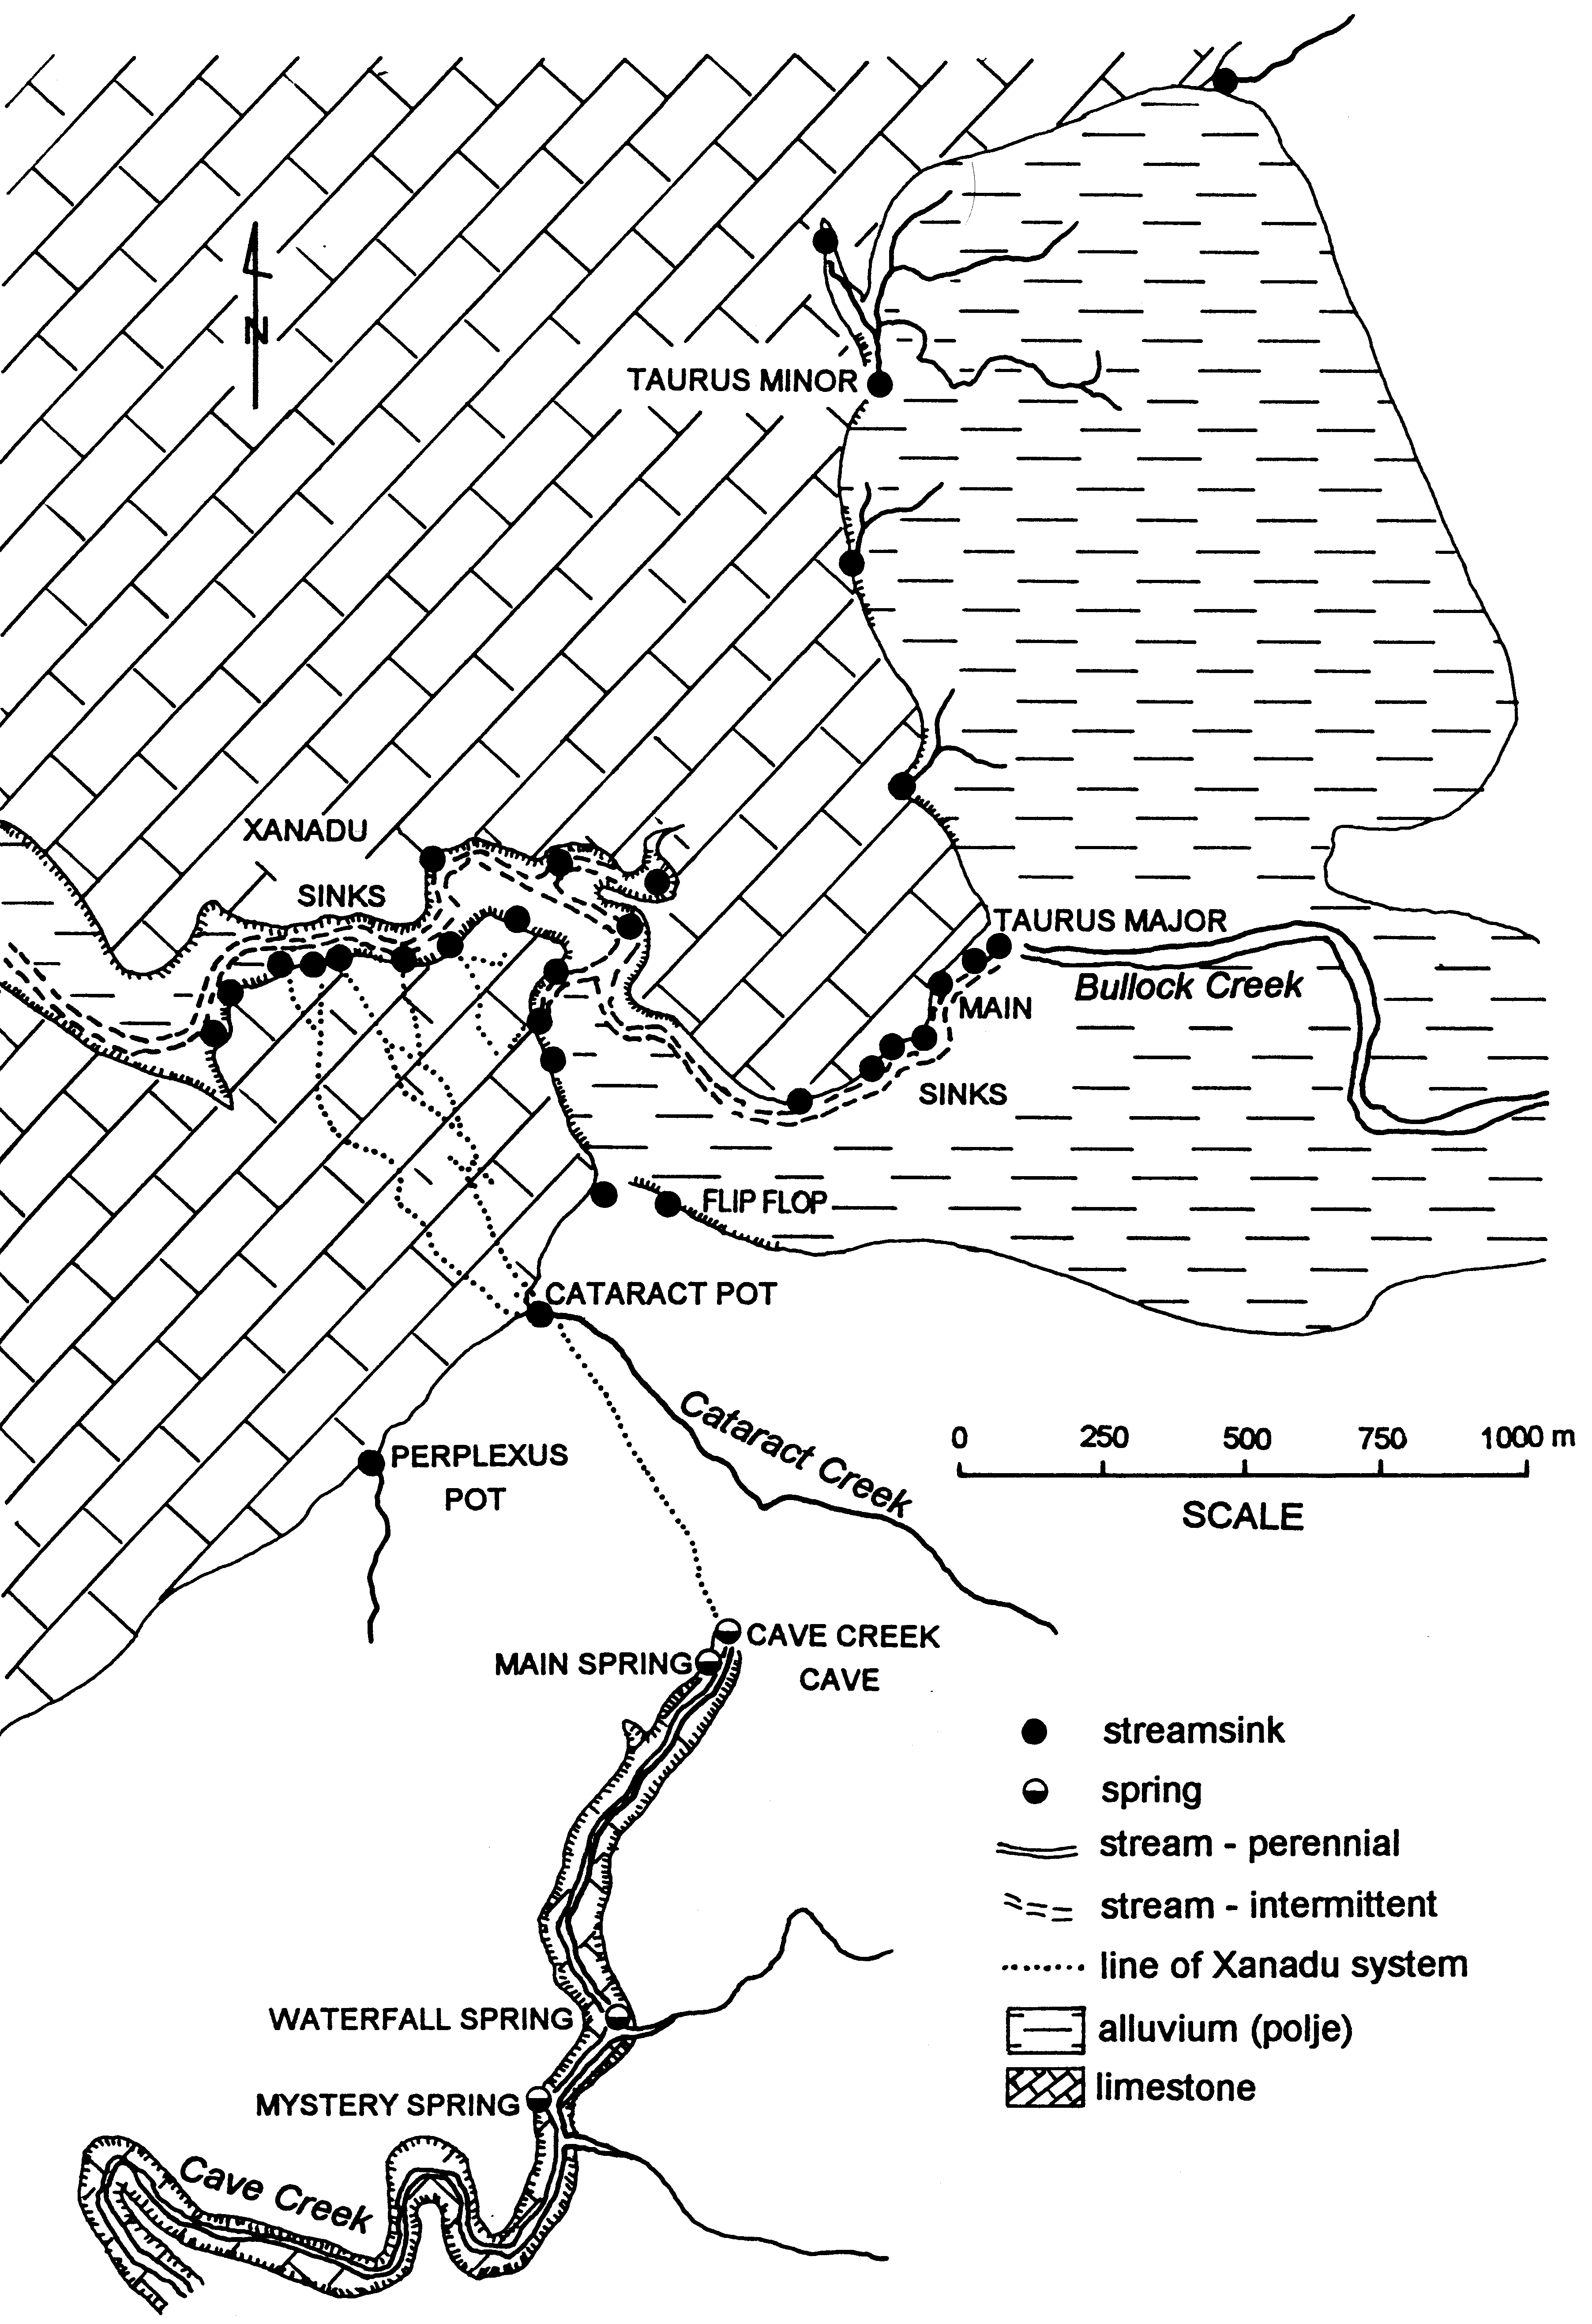
Figure 9. Location of stream-sinks and springs in the Bullock Creek - Cave Creek drainage system (from Crawford 1994)
SPELEOTHEM EVIDENCE FOR CLIMATIC CHANGE
It is well known that caves are important repositories of natural history, a particularly important site in the region being Honeycomb Hill Cave near Karamea, where the extensive avifauna deposits have been reported on and interpreted by Worthy and Mildenhall (1989). Speleothems also contain important records of past environments, especially through their δ18O and δ13C stable isotope sequences, which are proxies for environmental change. Williams et al. (in press) report on a composite isotopic record from eight speleothems from the Paturau to Punakaiki region covering the period from the present to 23.36 ka BP. This has yielded the best dated and most detailed terrestrial palaeoclimate record currently available in New Zealand. Its chronology is based on 43 TIMS uranium series ages (2σ errors averaging 1.1%) and 573 stable isotope subsamples. Speleothem samples were obtained from Wet Neck, Creightons and Twin Forks caves near Paturau, and Hollywood, Babylon and Wazpretti caves near Charleston and Punakaiki. The combined NW South Island (NWSI) speleothem δ18O record is shown in Figure 12, where it is compared with other international palaeoclimate records. Delta18O is mainly a proxy for temperature in this record with higher (less negative) values representing warmer conditions, although δ18O is also influenced by precipitation variations, so the temperature relationship is not a simple linear one. The time intervals represented by the Last Glacial Maximum (LGM), Antarctic Cold Reversal (ACR), and Younger Dryas (YD) events are identified by dashed vertical lines.
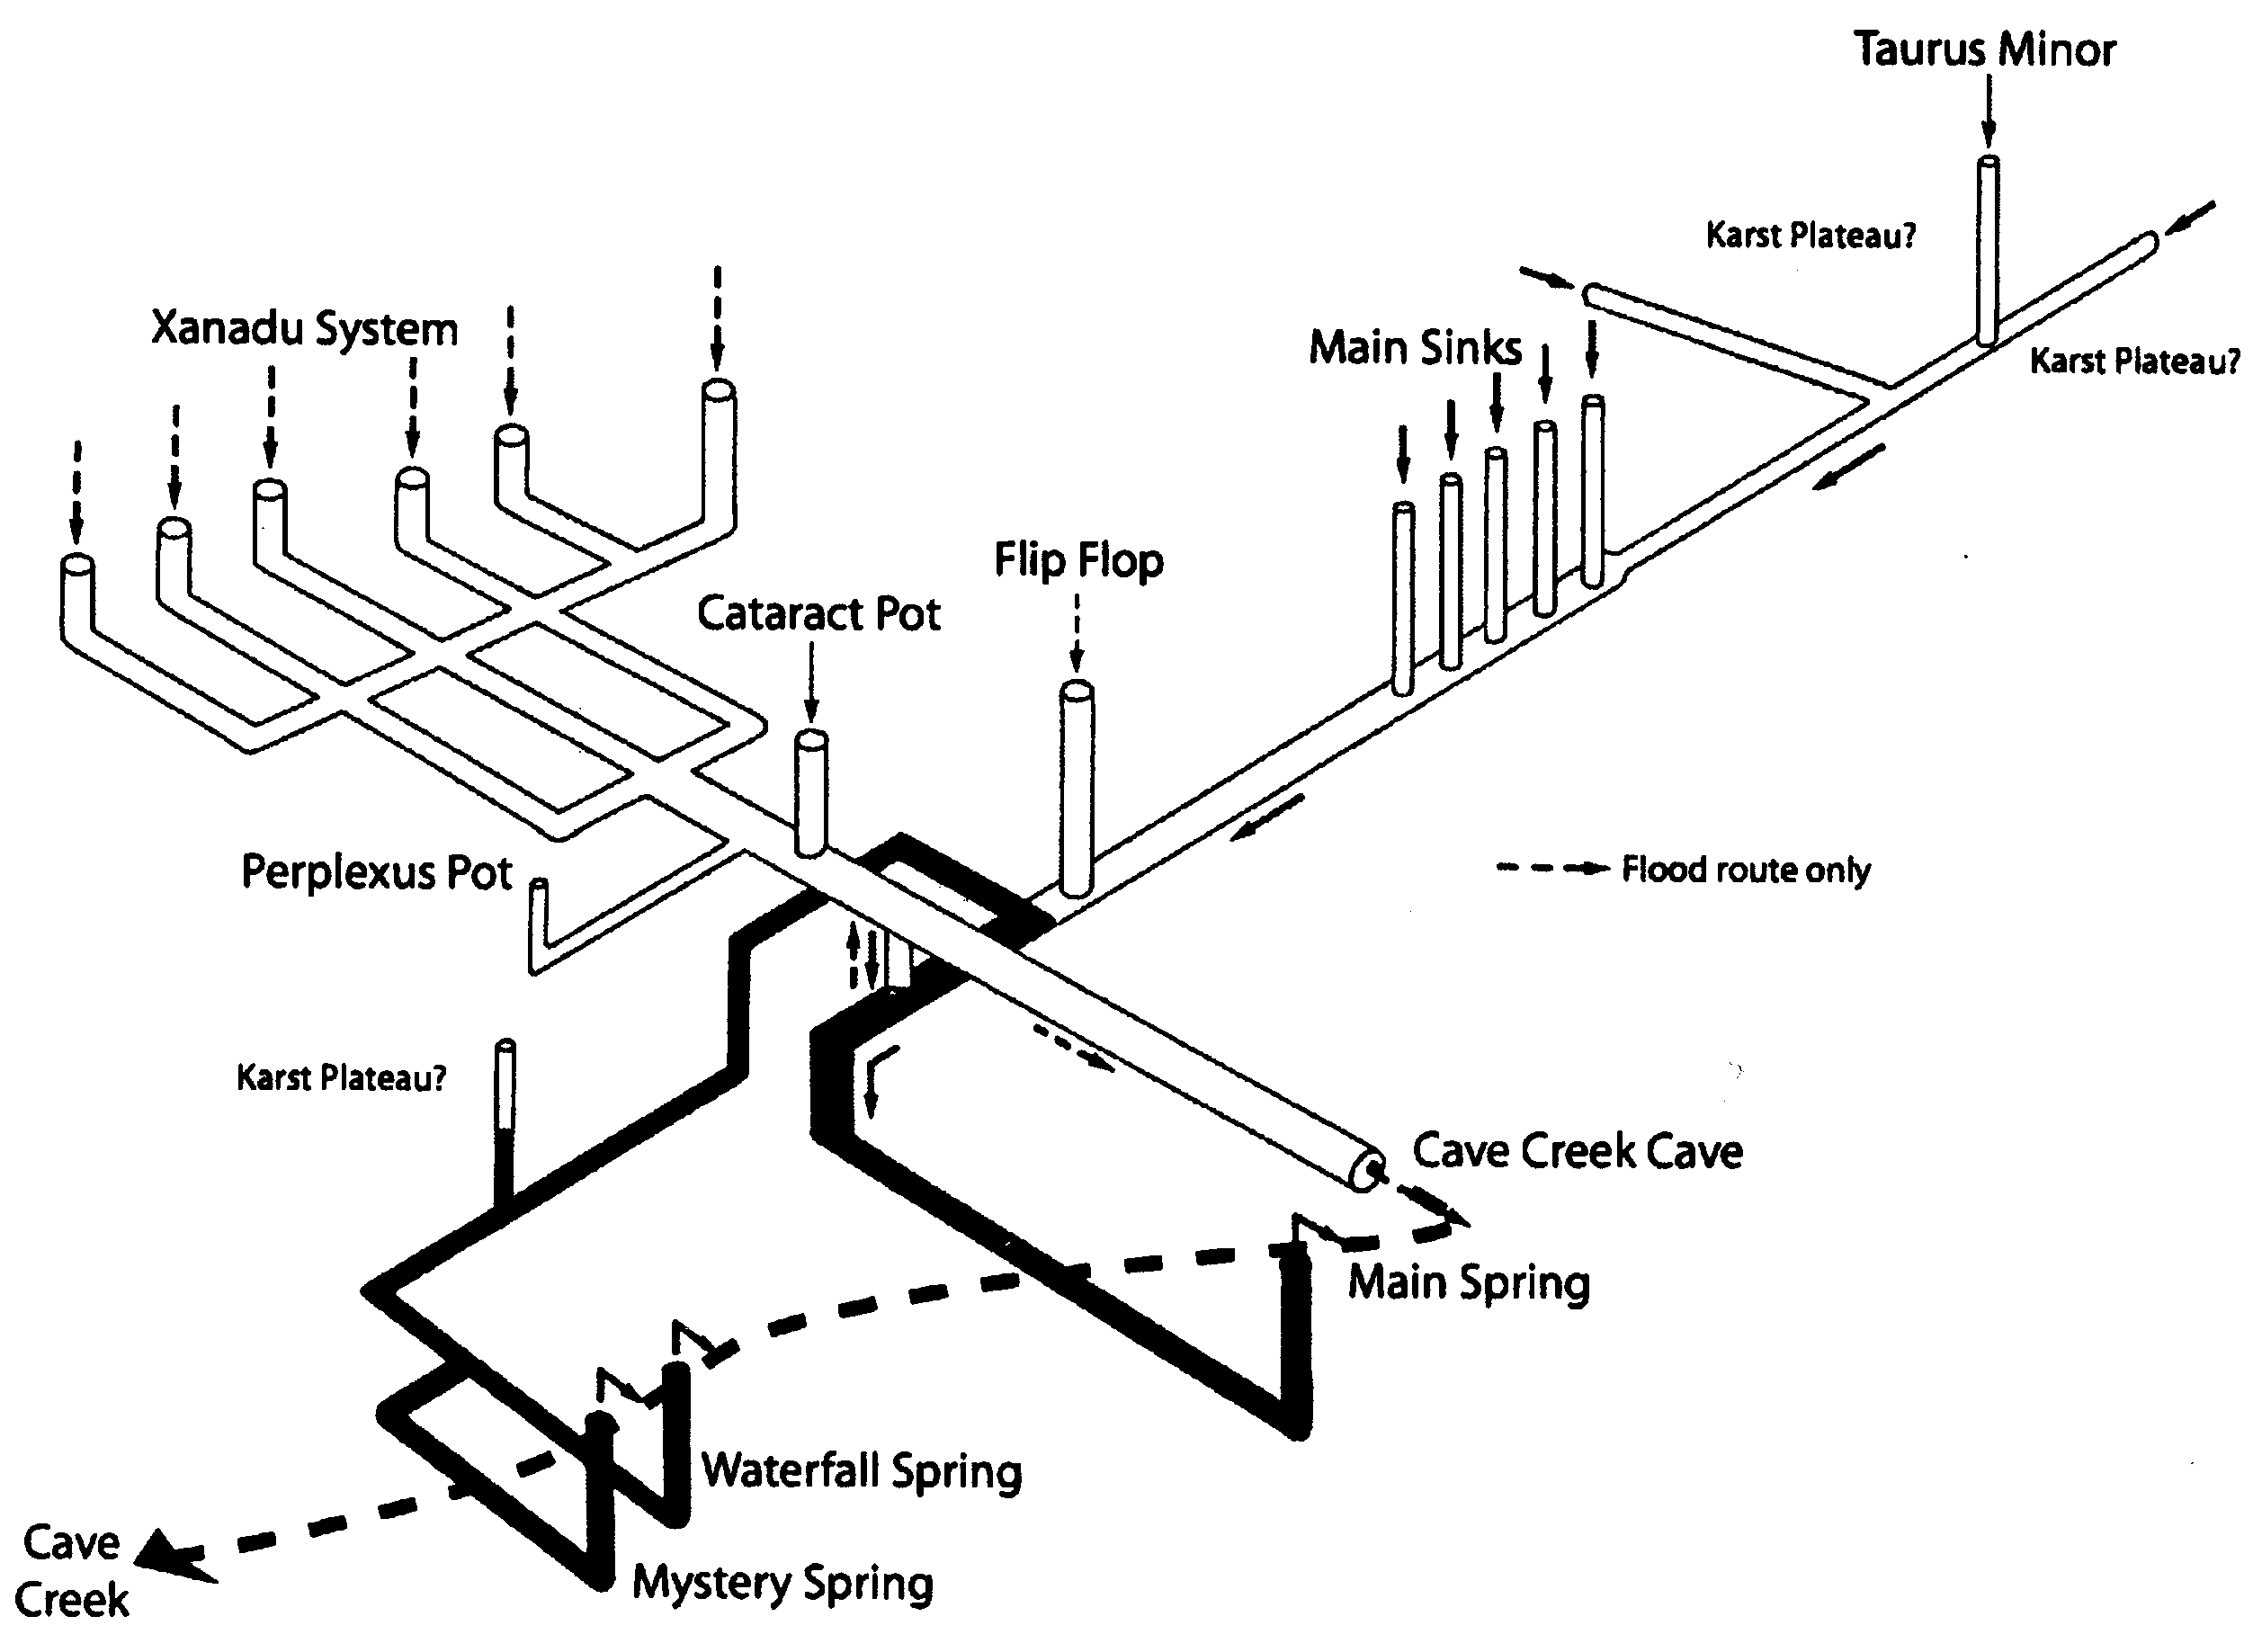
Figure 10. Conceptual plumbing diagram of conduits leading to Cave Creek springs (from Crawford 1994 with modification Williams 2004b). Taurus Major is the principal stream-sink of Bullock Creek. When its capacity is exceeded the excess water progressively travels downstream and progressively overflows the Main Sinks and then the Xanadu Cave system. Still larger flows result in surface overflow down the Bullock Creek Gorge to the coast. Conduits in the permanently saturated (phreatic) zone are shown in black, although the water-table can rise 75m during flood (measured in Flip Flop Cave). The most downstream outflow point is Mystery Spring and the most upstream outflow point is Cave Creek Cave, which is normally dry. These constitute underflow and overflow parts of the drainage system respectively. Under dry conditions, Main Spring is the most upstream of the permanent outflow points
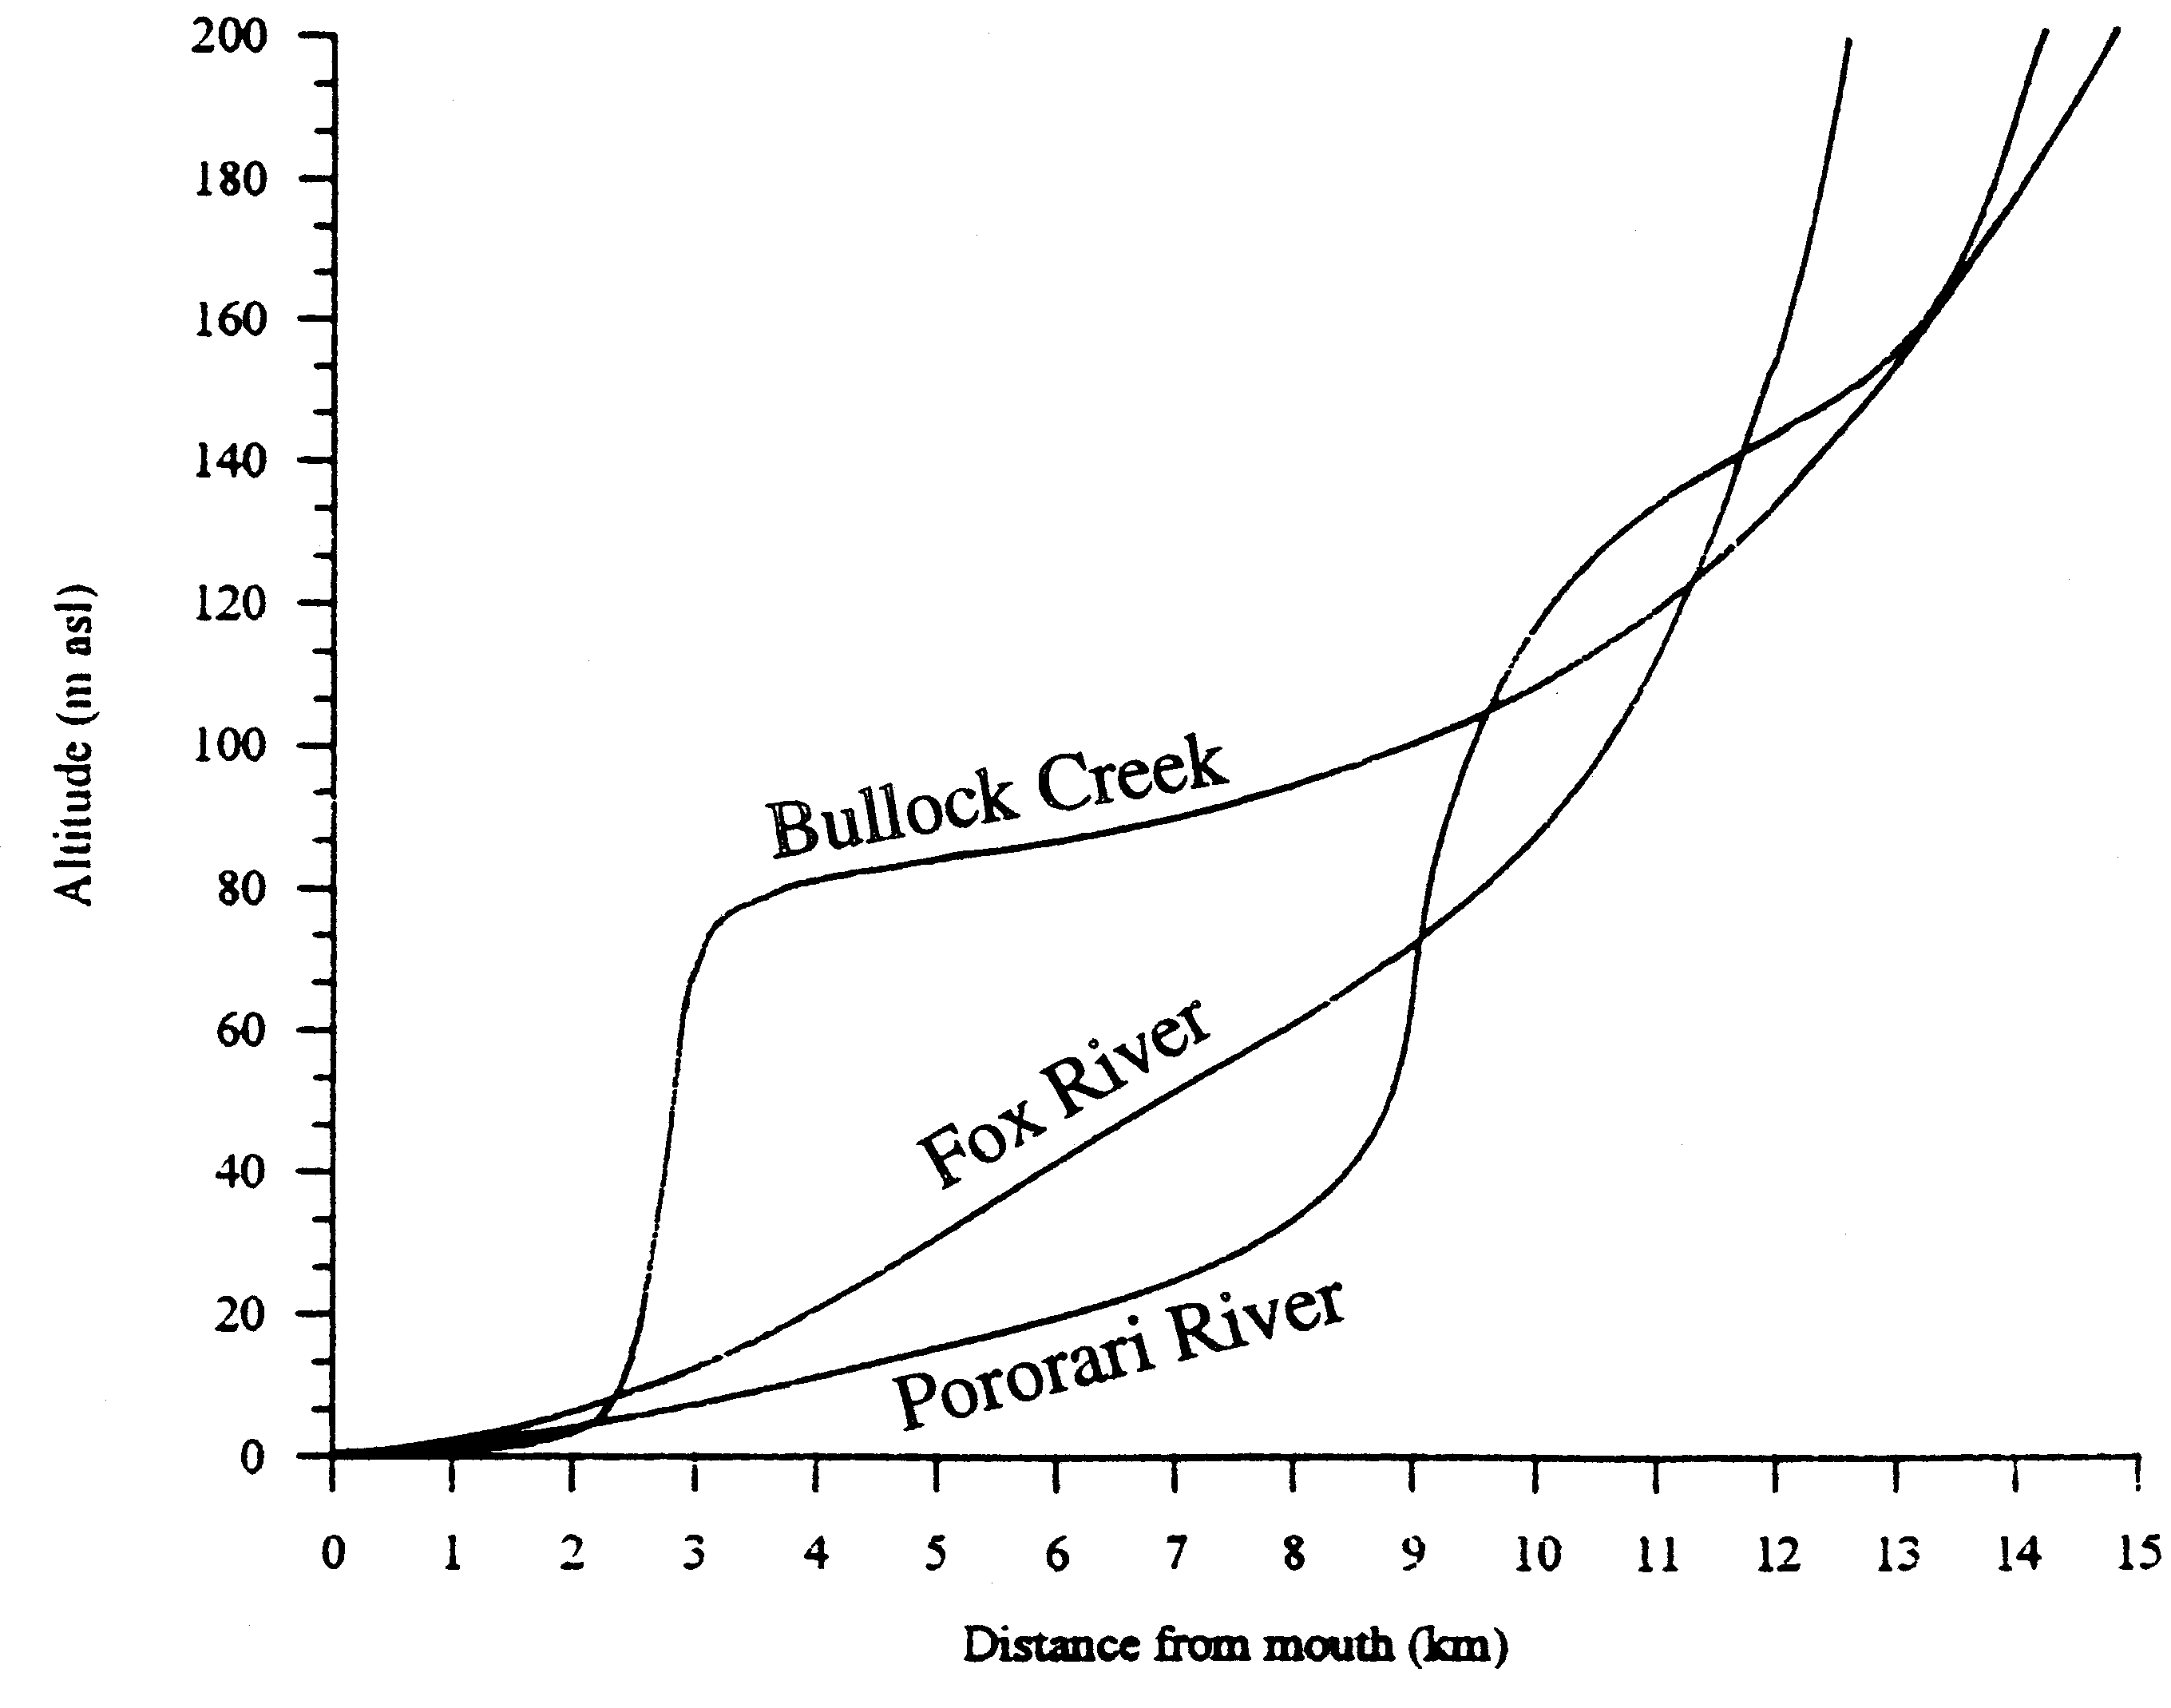
Figure 11. A comparison of the longitudinal profile of Bullock Creek with the longitudinal profiles of its northern (Fox River) and southern (Pororari River) neighbours (from Crawford 1994). A major landslide in the Bullock Creek valley 3-4 km upstream from the coast impounded its flow and caused backfilling of its valley by up to 60m of alluvium. This steepened the hydraulic gradient between Bullock Creek and the Pororari and encouraged the subterranean transfer of drainage to Cave Creek, a tributary of the Pororari.
Six climatic phases are recognisable from the NWSI speleothem 18O record: (1) the Last Glacial Maximum that was underway at the start of the record and lasted until 18.2 ka BP; (2) the last glacial-interglacial transition that commenced between 18.2 and 17.8 ka and accelerated after 16.7 ka, culminating in a positive excursion between 14.70 and 13.53 ka: (3) a late glacial reversal indicated by a significant negative δ18O excursion between 13.53 and 11.14 ka of up to 0.55% depth that overlapped the Antarctic Cold Reversal and spanned the Younger Dryas; (4) an early to mid-Holocene warm interval represented by positive δ18O excursions at 11.14 ka and 6.91-6.47 ka; (5) a mid-Holocene cool and variable interval from 6 to 2 ka that was marked by negative excursions that coincide with increased glacial activity in the South Island; and (6) a late Holocene warm event from 0.71 to 0.57 ka that was slightly later than the Medieval Warm Period of Europe and coincided with the main period of Maori settlement in New Zealand.
Of particular interest is the fact that the Late Glacial Reversal of the NZ-NWSI record does not correspond precisely in timing with the well known YD cool reversal of the Northern Hemisphere, because this shows that the climate systems of our two hemispheres are not as closely synchronised as sometimes suggested.
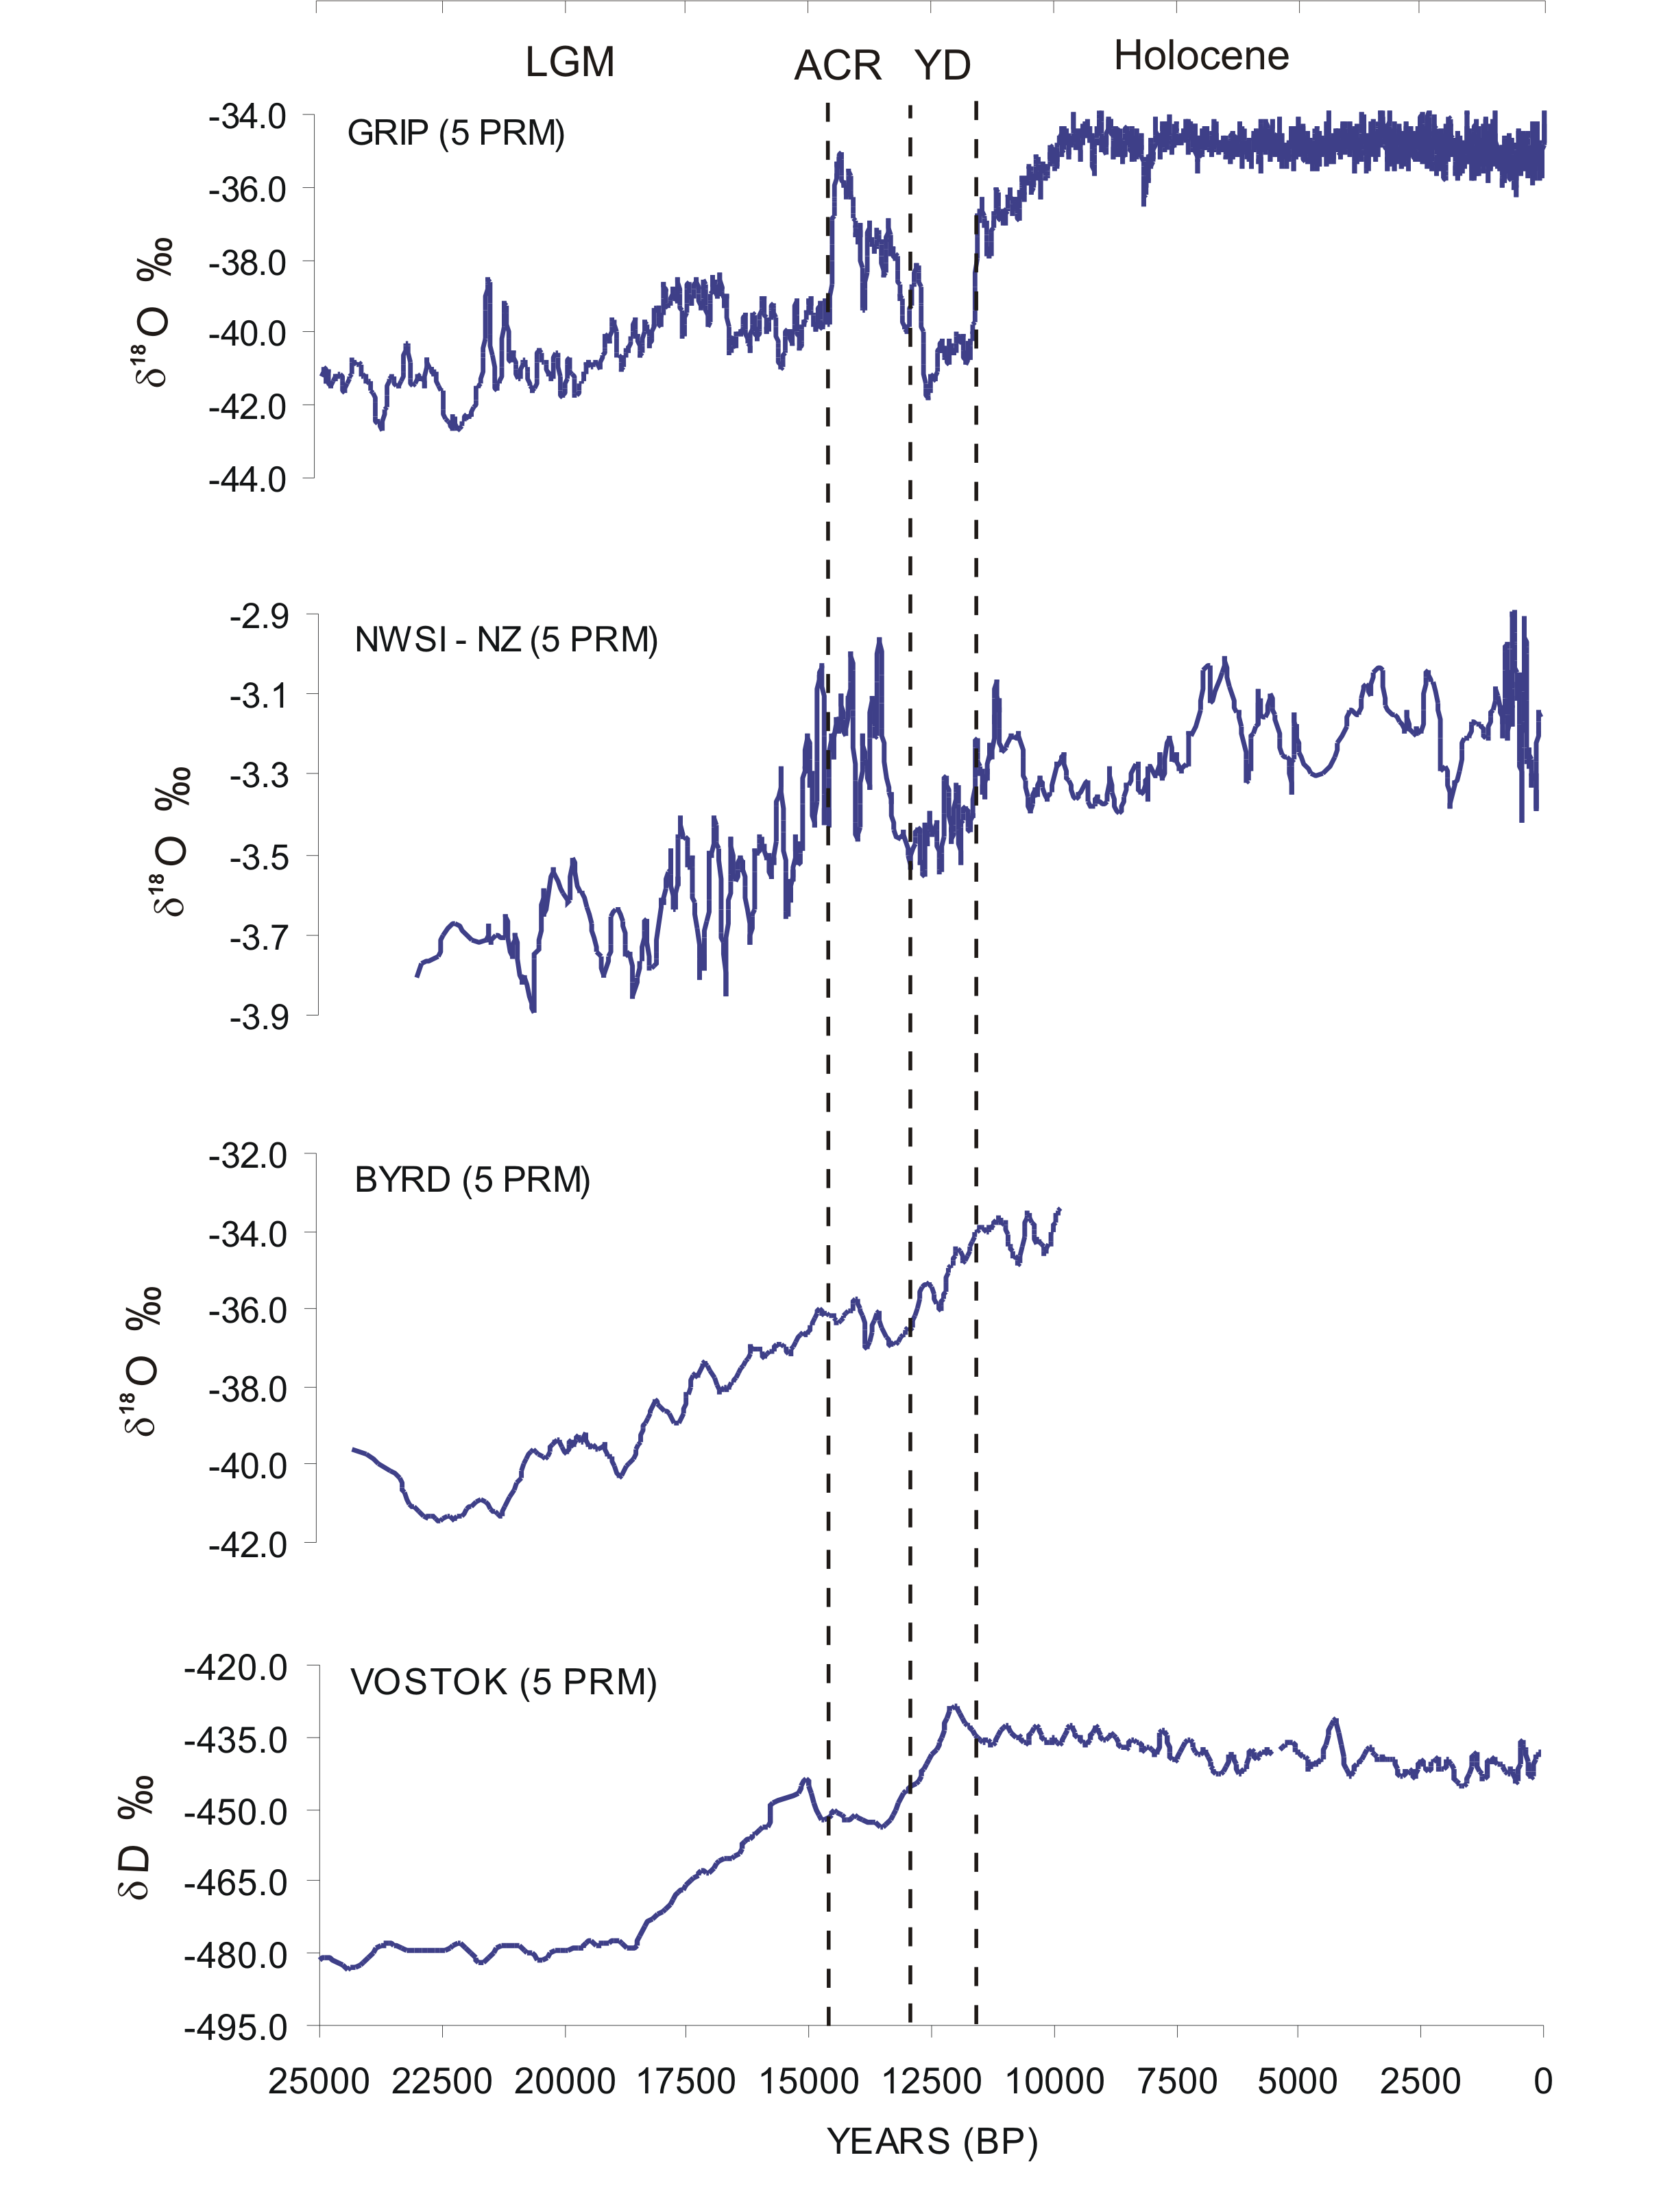
Figure 12. Comparison of New Zealand speleothem δ18Oc composite series from the northwest of the South Island (NZ-NWSI) with ice core data from Antarctica (Byrd and Vostok) and Greenland (GRIP). The δ18Oc series is smoothed with a five point running mean. Time intervals representing the LGM, ACR, YD and the Holocene are separated by dashed vertical lines. Ice core data were obtained from the NOAA Palaeoclimate archive. The ACR appears at slightly different dates in the Byrd and Vostok records because of uncertainties associated with dating ice cores.
It is clear from the spectrum of ages of speleothems found in the caves of NW South Island that much longer palaeoclimate records can be reconstructed and that much more is to be learnt about New Zealand's past climatic history. It is important that this be done, because our palaeoclimate is representative of mid-latitude maritime conditions in the Southern Hemisphere. If we are to understand how the climate of our planet operates, we must be able to compare the palaeoclimates of our two hemispheres. New Zealand is best placed to provide the Southern Hemisphere maritime palaeoclimate record, and New Zealand caves provide the best archives of that record.
REFERENCES
Bishop, D.G. 1971. Sheets S1 and S3 Farewell-Collingwood. Geological Map of New Zealand 1:63 360. NZ Geological Survey, DSIR, Wellington.
Crawford, S.J. 1994: Hydrology and Geomorphology of the Paparoa Karst, North Westland, New Zealand. Unpublished PhD thesis, University of Auckland.
Laird, M.G. 1988: Sheet S37, Geological map of New Zealand 1:63,360, New Zealand Geological Survey, New Zealand Department of Scientific and Industrial Research. Wellington.
Main, L. (ed.) 1993: The New Zealand Cave Atlas, Vol. 2: South Island. (Second edition). NZ Speleological Society , Occasional Publication 8 (ISSN 0112-7322)
Nathan, S. 1975: Sheets S23 and S30, Geological map of New Zealand 1:63,360, New Zealand Geological Survey, New Zealand Department of Scientific and Industrial Research. Wellington.
Tippett, J.M., and Kamp, P.J.J. 1995: Geomorphic evolution of the Southern Alps, New Zealand. Earth Surface Processes and Landforms 20, 177-192.
Williams, P.W. 1978. Interpretations of Australasian karsts. In J.L. Davies and M.A.J. Williams (Eds), Landform Evolution in Australasia. Canberra, Australian National University Press, 259-286.
Williams, P.W. 1982. Speleothem dates, Quaternary terraces and uplift rates in New Zealand. Nature 298, 257-260.
Williams, P.W. 1992. Karst in New Zealand. In J.M. Soons and M.J. Selby (Eds), Landforms of New Zealand. (Second edition), Chpt 8, 186-209. Longman Paul, Auckland.
Williams, P.W. 2004a. Karst systems. In J. Harding, P. Mosley, C. Pearson and B. Sorrell (Eds), Freshwaters of New Zealand. Chpt 31, 31.1-31.20. NZ Hydrological Society and NZ Limnological Society, Christchurch.
Williams, P.W. 2004b. The evolution of the mountains of New Zealand. In P.N. Owens and O. Slaymaker (Eds), Mountain Geomorphology. London, Arnold, 89-106.
Williams, P.W., King , D.N.T., Zhao, J.-X. and Collerson, K. D in press. Late Pleistocene to Holocene composite speleothem 18O and 13C chronologies from South Island, New Zealand - Did a global Younger Dryas really exist? Earth and Planetary Science Letters.
Worthy, T.H. and Mildenhall, D.C 1989. A late Otiran-Holocene palaeoenvironment reconstruction based on cave excavations in Northwest Nelson, New Zealand. NZ Journal of Geology & Geophysics 32, 243-253.