Build up and diffusion of carbon dioxide in the Glowworm Cave, New Zealand
Abstract
Carbon dioxide and visitor numbers are monitored continuously at two sites at the Glowworm Cave in Waitomo, New Zealand. These data show that concentrations of carbon dioxide increase over the short term in direct response to, on the one hand, tourist numbers and frequency of tour groups through the cave and, on the other, to cave microclimate in so far as this affects ventilation rates through the cave. From this it is clear that there are microclimate constraints on tourist cave management. However, little is known about diffusion rates of carbon dioxide through the cave, rates of increase, or maximum values under controlled conditions. A carefully monitored experiment, in which 220 people entered the cave, stayed for given time and then left was conducted to examine these processes. The study aimed to: a) assess rate of build up of carbon dioxide in cave air under conditions of high visitor usage; b) appraise nature and extent of diffusion of carbon dioxide through the cave from a single source area; and c) identify and examine cave atmosphere recovery rates. The cave entrances was sealed and ventilation prevented from occurring for approximately 90 minutes. Maximum concentrations of carbon dioxide were recorded were at the end of the 90-minute period at levels in the vicinity of 2,400 ppm. The results showed that diffusion rates of carbon dioxide through the cave are surprisingly rapid and constant. It took approximately one hour for carbon dioxide concentrations to travel from the source (a group of 220 people seated in one area) to an unoccupied, remote location along an elevated sealed passage about 75 metres away. The direction of diffusion was primarily upwards through the cave. Recovery rates were relatively rapid with about eighty per cent recovery occurring within one hour of the carbon dioxide source being removed. The implications for cave management are discussed.
Introduction
The Glowworm Cave is a small tourist cave located near the centre of the North Island of New Zealand in the heart of a limestone region called Waitomo. The Glowworm Cave is probably the best-known tourist cave in the world where cave fauna is the prime attraction. In New Zealand, it is a major tourist attraction that has played, and continues to play, a vital part in the development of the nation's tourist industry. To large numbers of tourists, from both New Zealand and overseas, a visit to the Glowworm Cave is a high point of their holiday experience. The Cave together with the geothermal areas in and around Rotorua has come to symbolise the North Island tourist encounter. For this reason, the value of the Glowworm Cave to New Zealand tourism extends beyond its great commercial importance.
Tourist caves, like most other natural tourist attractions, are sensitive to change or damage caused by the presence of visitors. The Glowworm Cave, however, is potentially more sensitive to the presence of visitors than most others. This is because of its small size and the presence of cave fauna crucial to its tourist appeal (de Freitas, 1998). This sensitivity combined with the fact that the Glowworm Cave is by visited hundreds of thousands of people annually make it a casebook for cave management study.
More people visit the Glowworm Cave than any other in Australia or New Zealand. Between 1979 and 1994 visitors to the Glowworm Cave doubled. On some days visitor numbers have exceeded 2,700, and in February 1996 a record 66,593 people visited the Cave giving a staggering daily average 2,296. Clearly, with this level of usage, there is growing potential for conflict to arise between the dual requirements of protecting and presenting the resource.
The Glowworm Cave has been used continuously as a tourist cave since late last century. Over this time several lessons have been learned. Most notably, during the 1970s, it was recognised that conditions in the Glowworm Cave were rapidly deteriorating. There was concern that many changes occurring would be irreversible but, at that time, little was understood about the cave environment and factors that controlled conditions in the cave. The problem peaked in April 1979 when the Glowworm Cave was closed because only four percent of the glowworms had their lights on. On occasions such as this the cost to the region in lost revenue can be considerable. The cave re-opened in the following July. Later that year, in recognition of the fact that the cave atmosphere is a fundamental element of a cave ecosystem, an intensive study of the microclimate of the Glowworm Cave began. This coincided with detailed in situ studies of glowworms and sedimentation process in the stream passing through the cave. The work culminated in a series of publications both in the form of university postgraduate theses and papers in international scientific journal literature. Results of this research were subsequently taken into account in setting out cave management guidelines. Despite all this research, relatively little attention has been paid to air quality, in particular, the part played by carbon dioxide. Consequently, management guidelines in relation to carbon dioxide are vague.
Carbon dioxide (CO2) and visitor numbers are monitored continuously at two sites at the Glowworm Cave. These data show that concentrations of carbon dioxide increase over the short term in direct response to, on the one hand, tourist numbers and frequency of tour groups through the cave and, on the other, to cave microclimate in so far as this affects ventilation rates through the cave. However, little is known about diffusion rates of carbon dioxide through the cave, rates of increase, or maximum values under controlled conditions. In light of this, a carefully monitored experiment in which a large number of people entered the cave, stayed for given time and then left was conducted to examine these processes. The study aimed to: a) assess rate of build up of carbon dioxide in cave air under conditions of high visitor usage; b) appraise nature and extent of diffusion of carbon dioxide through the cave from a single source area; and c) identify and examine cave atmosphere recovery rates.
Background
Elevated carbon dioxide concentrations can affect both people and limestone features of the cave. Opinions differ as to acceptable standards of CO2 in cave air, but a primary objective of cave operators is to maintain a stress free and safe cave environment for tourists and, at the same time, maintain cave air quality at levels that ensures that cave features are not adversely affected.
What constitutes permissible level of carbon dioxide depend on whether the reference is to ventilation and air quality standards or to health, safety and physiological wellbeing. The human body's response carbon dioxide is known as hypocarnapia, the symptoms of which are increase in respiration rate, peripheral vasodilation, sweating or shivering, headache and drowsiness (Armstrong and Osborne, 1981; Stupfel, 1974). The American Society of Heating, Refrigerating and Air-Conditioning Engineers (1989) give a ventilation design standard for buildings of 1000 ppm (0.1%), which may used as a surrogate for caves, but this relates to guidelines on odour and staleness and are not based on physiological wellbeing. Exposure to CO2 levels in the range 0.03 to 3.0 percent has been assessed by Weitzman, Kinney and Luria (1969) who found that prolonged exposure caused impairment of vision in the dark and colour sensitivity. New Zealand occupational and safety standards (New Zealand Department of Labour, 1994) use two levels depending on exposure time. One is 5,000 ppm known as the Workplace Exposure Standard, given as the 8-hour time weighted average exposure standard. The other is 30,000 ppm called the Short-Term Exposure Limit, given as the 15-minute average exposure standard.
The level of carbon dioxide in the cave air is determined by the balance between the rate input of CO2 to the cave and losses (sinks) of CO2 from the cave air. The sources of carbon dioxide in caves such as the Glowworm Cave are:
- Respiration of people in the cave
- Desorption from water of stream flowing through the cave
- Oxidation of organic material and respiration by micro-organisms
- Diffusion of soil gas through soil and rock into the cave and vadose solutions entering cave
- Outside air flowing into the cave (ventilation)
In the absence of air exchange with the outside environment, the concentration of carbon dioxide in the cave air is a function solely of the rate of CO2 input from sources 1 to 4 above.
Sinks of carbon dioxide in caves such as the Glowworm Cave are:
- Airflow and air exchange with outside (ventilation).
- Solution in undersaturated cave water.
- Diffusion through (porous) cave walls.
Depending on whether CO2 concentration in the cave is greater or less than that outside, air exchange can be either a source or sink of CO2. Ventilation is therefore a major control of the concentration of carbon dioxide in the cave air.
In tourist caves humans are clearly the major cause of elevated concentrations of CO2, directly through respiration and indirectly by promoting the activity of bacteria and other micro-organisms that feed on organic matter including skin and hair shed from the human body. People exhale air that is slightly depleted in oxygen and enriched in carbon dioxide (approximately 4% carbon dioxide). Levels reached depend on visitor numbers and ventilation rates through the cave. One person exhales carbon dioxide at approximately 17 l/hr (Marion, 1979); thus a tour group of 200 visitors expels about 3,360 l/hr. Concentrations of carbon dioxide as high as 5,000 ppm have been recorded in the Glowworm Cave.
A threshold of 5,000 ppm CO2 is widely considered to be the maximum acceptable for tourist caves; however, the allowable level that should be specified in cave management guidelines is open to debate (Dragovitch and Grose, 1990). Added to this is the concern that when carbon dioxide concentrations exceed about 2,400 ppm, water can combine with CO2 forming a weak acid, which can lead to corrosion of limestone features of the cave. For this reason, 2,400 ppm is taken at the maximum permissible level to which CO2 concentrations should be allowed to rise in the Glowworm Cave. It is based on the work of McCabe (1977) and Kermode (1974, 1980) at Waitomo. However, the reliability of this threshold value as a universal management guideline to prevent corrosion of speleothems is questionable.
Study Site
The study site is the Glowworm Cave, the best known of eight commercial show caves in New Zealand, is located in the Waitomo district 55 km south west of the city of Hamilton, in the North Island of New Zealand (38°15' S, 175°06' E). The cave is situated in a ridge of Oligocene limestone with the lowest part of the cave, the lower entrance, 60m above sea level. The cave has two entrances vertically 14m apart linked by 1300m of interconnected passageways and chambers.
The Upper Entrance is an irregular shaped 5.7m2 opening, which leads into a small chamber at the junction of the Main Passage and Blanket Chamber Passage. The Blanket Chamber Passage varies between 1 and 4.5m in diameter and extends horizontally for 40m terminating at the Blow Hole, a constriction of 0.83m2. The Main passage is a 39m long phreatic passage varying between 3 and 7m2 in cross sectional area. It extends to the Catacombs, which is a small cavern approximately 3.5m high and 5.5m wide. The 40m long Organ Loft Side Passage was originally a continuation of the Blanket Chamber and Catacombs section of the cave but is now separated by a large collapse chamber approximately 5m high and 5m wide. The Organ Loft Side Passage is cul-de-sac passage at the end of which is located an attractive speleothem display. The Organ Loft and its attractions are very popular with visitors. The Cathedral is the largest chamber in the cave with dimensions of 40m in length, 11m in width and 13m in height. The Cathedral links all sections of the cave including the Demonstration Chamber, Glowworm Grotto, Blanket Chamber and Organ Loft.
The Glowworm Grotto is a water filled chamber approximately 30m long, 10m wide and 5m high which contains the main display of the glowworm Arachnocampa luminosa, the main attraction of the cave. The Grotto is also connected to the Main Passage aloft by a 13m vertical shaft called the Tomo. The Waitomo Stream flows into the Grotto through the lower entrance via a 40m tunnel. The area of free air space at the Lower Entrance varies depending on stream level but usually is similar to that of the Upper Entrance. From the Grotto the stream sumps for a short distance and then emerges at the Demonstration Chamber, a section of stream passage which is joined to the Cathedral. Down river of the Demonstration Chamber the stream again sumps before resurging outside of the cave.
Earlier work (de Freitas et al, 1982) has shown that airflow through the Glowworm Cave is a function of the cave's configuration, in particular, the number and location of the two entrances, one above the other. The two entrances facilitate "chimney effect" airflow through the cave, the direction and speed of which are directly related to the cave-to-outside temperature gradient (de Freitas et al, 1982; de Freitas and Littlejohn, 1987).
Method
The central part of the Glowworm Cave called the Cathedral is known for its good acoustics. Because of this, the cave is occasionally booked for group singing events. These usually take place late in the day, after scheduled visitor tours have ended. One such event featuring international opera singer Dame Malvina Major and tenor Simon O'Neil took place on the evening of 25 April 1998. It was a formal occasion for invited guests only, organised by the national group, Friends of Opera New Zealand Opera. The carefully planned nature of the event, with precise guest arrival and departure times of a discrete group made it an attractive study opportunity. In all, 240 people were seated for 130 minutes in the Cathedral, which is the central, core region of the cave.
The last scheduled cave tour of day ended at approximately 1645 hours when a team of approximately eight people began preparing seating in the cave for the opera event. At 1725 hours the choir of 40 people entered the cave followed at 1740 hours by 170 invited guests. The upper entrance to the cave was closed at 1800 hours. This is a sealed opening with an airtight door. The door remained closed until 1925 hours when it was opened very briefly to let some officials out of the cave. At 1930 hours the door was opened and kept open until 2130 hours when the cave was closed for the night.
Measurements of three variables, carbon dioxide and wet and dry bulb temperature were made at seven sites in the cave and one outside the cave. The measurement sites were the upper Cathedral, Organ Loft, Organ Loft Side Passage (OLSP), the upper end of the Blanket Chamber, Glowworm Grotto, upper Tomo, outside the lower entrance and Cathedral floor (Figure 1). An Assmann psychrometer was used for wet and dry bulb measurements. When the door to the upper entrance was opened, airflow was measured with Dwyer Series 470 hot wire anemometer Three different types of carbon dioxide measuring equipment were used. Readings were taken every ten minutes. In addition wet and dry bulb temperature (Campbell 107B force-ventilated thermistors, accuracy ±0.1°C) and carbon dioxide (Vaisala GMP111E, response time 50 sec, accuracy <±3 percent of range) data and air flow direction and speed (Vector A101M sensitive cup anemometer, starting speed 0.15 m/s) through the upper entrance were monitored continuously as part of the permanently installed automated cave monitoring system (de Freitas, 1998). These sites are at the Glowworm Grotto, Banquet Chamber, Tomo and outside the upper entrance. Data are gathered and stored on two Campbell Scientific dataloggers, Models CR10X and CR10, but historical and real-time data could be viewed both as graphical and digital output using a laptop computer attached to the system, located in main ticketing office outside the cave.
To test the suitability of equipment for measuring carbon dioxide three different systems were used. The reference equipment were two, recently calibrated Vaisala units that formed part of the fixed automated monitoring system. The Vaisala units measure CO2 in the range is 0 - 7000 ppm. The detector used in the transmitter is a single wavelength, non-dispersive infrared gas sensor. This technique makes the sensor highly gas specific as it is not sensitive to other gases including water vapour. The sensor is diffusion aspirated and has a rapid 50-second response time. A portable Gas Tech (Model RI-411) non-dispersive infrared unit was also used. This gives readings to the nearest 25 ppm. A durable diaphragm pump continuously draws atmospheric samples to the instrument. It reads in the range of 0 to 4975 ppm, with an operating range of 0 - 95 per cent relative humidity. Finally, Drager tubes were used as these have been used in many studies into cave CO2 reported in the literature. The Drager tube is a glass tube fused at both ends and filled with sensitised crystals. To measure CO2 both tips of a Drager tube are broken off and the tube is inserted into a bellows pump. After a prescribed number of strokes of the bellows are made, CO2-sensitive crystals in the tube gradually change colour. Changes in colour of the crystals in the glass tube are gauged by matching the leading edge of the colour change with graduations marked on the tube. Measurement error is ±15 percent in the range 100-3000 ppm CO2.
Results
Conditions of the experiment involved 220 people seated in the cave for 110 minutes, with the upper entrance closed off for the last 90 minutes. Figure 2 shows continuous the results of continuous measurements of carbon dioxide at both the upper Cathedral and Organ Loft sites for the periods leading up to and following the experimental period. It also shows the times of door openings and closings, the points at which opera guests arrived and left, and data on speed of airflow through the upper entrance to the Glowworm Cave.
At the start of the concert, CO2 concentration was approximately 1,300 ppm (Figure 2). This rose by 900 ppm to 2,200 ppm during the 110 minutes the opera group was in the cave. A rise in CO2 is rapid and occurs shortly after guests are seated. Recovery is equally rapidly as people leave the cave. The peak first occurs at the source, namely in the Cathedral, and then one hour later in the Organ Loft at the end of the cul-de-sac Organ Loft Side Passage. There is a small drop in CO2 concentration in the Cathedral and Organ Loft shortly before the door was left open and the point at which the highest CO2 concentration was reached. This coincides with the brief opening of the door at 1925 hours to let some officials out of the cave prior to the concert guests leaving.
It is notable that the peak in CO2 concentration is the same in both the Cathedral and Organ Loft (Figure 2). This indicates that diffusion of CO2 is upwards through the cave and is almost 100% effective, even to poorly ventilated parts of the cave such as the OLSP. The driving process, therefore, is likely to be thermal as the warmer, CO2-charged air moves upwards and outwards. Figure 3 shows that the Blanket Chamber and OLSP peak at the same time, both areas being elevated zones adjoining the upper reaches of the Cathedral. There is a time lag of approximately 15 minutes for the CO2-charged air to work its way up through the cave to the Tomo site (Figure 3). The lower parts of the cave namely the Modern Art Chamber, and the lowest of all, the Glowworm Grotto are only slightly affected by increased CO2 levels elsewhere in the cave. The decline in CO2 occurs more rapidly in the Cathedral compared to the Organ Loft, as would be expected as part of the more gradual diffusion process of CO2 into the poorly ventilated OLSP (Figure 2).
Recovery time of carbon dioxide in the air is shown by the rate of decline in the curve for the Cathedral from 1925 hours when the door to the upper entrance is finally opened (Figure 2). It takes approximately 120 minutes for CO2 to drop by 1,700 ppm from 2,200 ppm to 500 ppm. The rapid response at the Cathedral site contrasts with the more gradual decline one hour later in the OLSP in which ventilation is much reduced. Of the other sites, the Tomo is the quickest to respond due to its proximity to the main airflow route up through the cave to the upper entrance.
Carbon dioxide measurements using the Drager tubes proved to be inappropriate for precise measurements as required in a study of this type. Readings based on gradual colour changes to crystals in the tube are difficult to interpret, and graduation markings on which readings are based are a minimum of 100 ppm apart, and as much as 500 ppm for CO2 concentrations greater then 1000 ppm. This finding is surprising given the widespread use of the Drager technique in cave environmental assessments.
Discussion and Conclusion
The results of the experiment show that rate of build up of carbon dioxide in cave air under conditions of high visitor usage is rapid, and that a rise in CO2 concentration of 800 ppm can occur in a relatively short period of time (90 minutes). Dispersion of the CO2 enriched air is surprisingly efficient, spreading even to the most remote and poorly ventilated parts of the cave even when flow-through ventilation of the cave was severely restricted by closing off the upper entrance of the cave. Dispersion is primarily upwards suggesting that the process is thermally driven. The cause is the combined effect of respired air and metabolic heat from the gathering of people warming the air within the assembled group (de Freitas, 1985). The result is a thermal plume that moves and mixes by convection upwards.
The role and efficiency of "chimney effect" ventilation of the cave was demonstrated by the relatively fast decline in CO2 once the upper entrance was opened. Recovery rates were rapid with about eighty per cent recovery occurring within one hour of the carbon dioxide source being removed. Full flushing occurs within approximately two hours.
It should be noted that although CO2 alone is more dense than air, respired CO2 is well mixed and will not separate from an air parcel and settle to the floor of the cave. However, if CO2 enriched air enters the cave at floor level and its temperature is less than the surrounding air or its density exactly the same (temperature and humidity), then it is possible for the carbon dioxide enriched air to exist for some time as a layer at floor level until molecular diffusion or turbulence mixes the CO2 enriched air into the larger volume air surrounding around it. This could be important in circumstances where the source of CO2 in the cave is water (McCabe, 1977), respiration by micro-organisms or diffusion of soil gas through soil and rock into the cave and vadose solutions entering cave, especially if accompanied by cool or stable ambient conditions.
Previous recommendations for visitation rates at the Glowworm Cave have been based on number of people in the cave per hour. Given that for some time it has been recognised the Organ Loft is a trap for CO2 and that concentrations increase rapidly with visitors present, tour groups that visit this area of the cave have been strictly controlled. However, the results of this work show that CO2 levels in the Organ Loft are not solely a response to CO2 emissions from that site alone. In fact, concentrations reflect CO2 emissions elsewhere in the cave and are cumulative. This does not apply to certain other locations; namely those at lower levels, such as the all-important Glowworm Grotto. Clearly, the cave management implications of this are important.
References
American Society of Heating, Refrigerating and Air-Conditioning Engineers (ASHRAE), 1997: 1997 ASHRAE Handbook. American Society of Heating, Refrigerating and Air-Conditioning Engineers Inc., Atlanta.
Armstrong, R. and Osborne, L., 1981: Towards an air quality standard for tourist caves: studies of carbon dioxide enriched atmospheres in Gaden-Coral Cave, Wellington Caves, NSW Helictite 19 (2), 48-56.
de Freitas, C.R., 1998: Cave monitoring and management: The Glowworm Cave, New Zealand. In: Cave and Karst Management in Australasia XII. Proceedings of the Twelfth Australasian Conference on Cave and Karst Management, Waitomo, Australasian Cave and Karst Management Association, Carlton South, Victoria, 55-66.
de Freitas, C.R., Dawson, N.J.,Young, A.A. and Mackey, W.J., 1985: Microclimate and heat stress of runners in mass participation events. Journal of Climate and Applied Meteorology, 24, 184?191.
de Freitas, C.R. and Littlejohn, R.N.,1987: Cave climate: assessment of heat and moisture exchange. International Journal of Climatology, 7, 553-569.
de Freitas, C.R., Littlejohn, R.N., Clarkson, T.S. and Kristament, I.S., 1982: Cave climate: assessment of airflow and ventilation. Journal of Climatology, 2, 383-397.
Dragovitch, D. and Grose, J., 1990: Impact of tourists on carbon dioxide levels at Janolan Caves, Australia: an examination of microclimate constraints on tourist cave management. Geoforum, 21 (1), 111-120.
Ek, C. and Gewelt, M., 1985: Carbon Dioxide in Cave Atmospheres. New Results in Belgium and Comparison with other Countries. Earth Surface Processes and Landforms. 10, 173-187.
Kermode, L.O., 1974: Glowworm Cave Waitomo: conservation study. New Zealand Speleological Bulletin, 5, 329-344.
Kermode, L.O., 1980: Cave corrosion by tourists. Proceedings of the Third Australasian Conference on Cave Tourism and Management, 1979, 97-104.
Marion, J.B., 1979: General Physics with Bioscience Essays. Wiley, New York.
New Zealand Department of Labour, 1994: Workplace Exposure Standards Effective from 1994. Occupational Health Services, Department of Labour, Wellington.
McCabe, B., 1977: The Geochemistry of Ground Water Solutions Entering Limestone Caverns. MSc dissertation, Department of Chemistry, University of Waikato, 145pp.
Stupfel, M., 1974: Carbon dioxide and temperature regulation in homeothermic mammals. In Nahas, G. and Schaefer, K.E., 1974: Carbon Dioxide and Metabolic Regulations. Spriger-Verlag, New York, pp. 163-186.
Weitzman, D.O., Kinney, J.A.S. and Luria, S.M., 1969: Effect on vision of repeated exposure to Carbon dioxide. Underwater Medicine and Related Sciences Guide to Literature 1973, 1665. Cited in Armstrong, R. and Osborne, L., 1981: Towards an air quality standard for tourist caves: studies of carbon dioxide enriched atmospheres in Gaden-Coral Cave, Wellington Caves, N.S.W. Helictite 19 (2), 48-56.
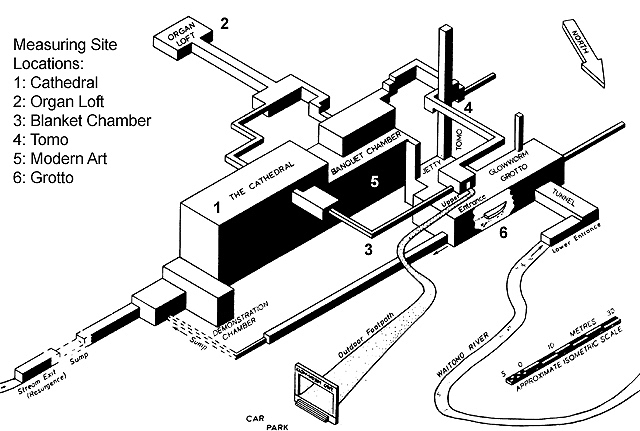
Figure 1. Schematic illustration of the Glowworm Cave showing monitoring sites.
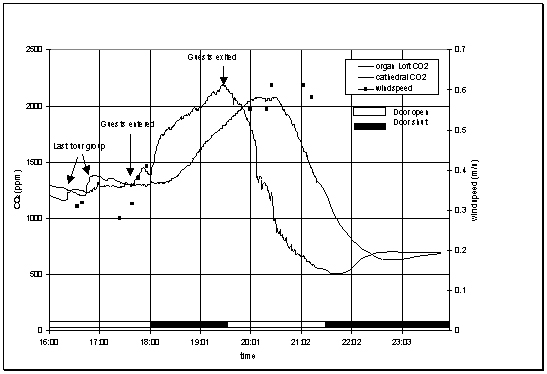
Figure 2. Carbon dioxide concentration (ppm) near the roof of the Cathedral and at the end of the cul-de-sac Organ Loft Side Passage and airflow (m/s) through the upper entrance of the Glowworm Cave on April 25 1998 from 4pm to midnight. Bars on lower portion of the figure show periods the upper entrance door was open or closed off to the outside air.
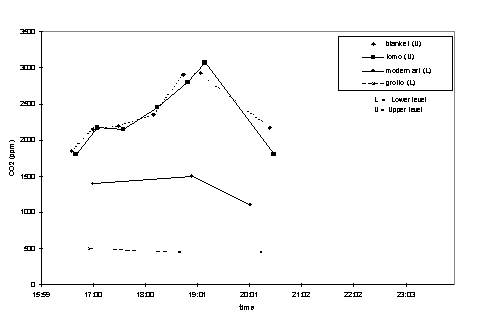
Figure 3. Carbon dioxide concentration (ppm) at four sites in the Glowworm Cave based on spot measurements using the Gas Tech CO2 monitor, from 4pm to midnight, 25 April 1998.