World-wide show cave visitor numbers over the recent past
A preliminary survey
Optimal Karst Management1 (www.karstmanagement.com) and JM Spate Web Analytics2 (www.drjess.com)
Email: aspate1@bigpond.com1
Abstract
This paper provides a very preliminary investigation of the changes in visitor numbers in show caves world-wide over the last decade with some longer datasets available. There were problems in the way in which data was sought and in the way in which very many generous people provided data. Thus the data we discuss here is limited geographically and temporarily.
It is intended to make this a first step in developing a far better understanding of show cave visitation world-wide.
Introduction
The Australasian Cave Tourism and Management Conference Proceedings provided annual visitor numbers for Australian show caves for a number of years. Unfortunately in recent decades this has not happened for a variety of reasons. To the best of our knowledge there has never been a review of these annual series to examine trends, peaks and troughs. Nor has there ever been an attempt to review such figures in the light of local events such as floods and earthquakes or international happenings such as the SARS “epidemic”, the GFC or the current European economic woes.
In discussions with Greg Martin we were advised of dramatic changes in the Waitomo Glowworm Cave visitor numbers over a few decades, so we thought we should look further afield and see what is happening in Australia, New Zealand and at as many show cave sites in Britain, Europe, Asia, Africa and South and North America as we could obtain responses from given the short time frame leading up to the Waitomo Conference.
This paper will present a very preliminary view of what is happening world-wide. Little analysis of the data is presented primarily due to the poor temporal and geographic spread of the data – although we have been provided with some excellent datasets as shown below. This paper is intended to be a precursor to further work.
However, as Brian Clarke has pointed out to us recently absolute visitor numbers do not tell us much – it is the experiences we offer, what value adding we do and what the visitors contribute to the local economy and our business which are the important factors.
The survey
Once the idea had been generated by the contact between Greg Martin and Andy the idea of looking around the world arose. After data started arriving it was obvious that a professional data analyst was needed. Thus came the involvement of Dr Jess Spate.
Initially we asked for visitor numbers for the past decade. We said that we were happy to receive percentage changes if the various site had “commercial in confidence” issues. However, it became obvious that our requests in both the detail we wanted and the length of record were inadequate.
Visitor numbers for the last decade were sought in waves from:
- All Australian show cave operators
- Three New Zealand operators
- Personal contacts in Brazil, USA, United Kingdom, Europe, Asia, Bermuda and South Africa
- The National Caves Association (USA)
- The International Show Caves Association (ISCA)
Realising our mistake we contacted our respondents and requested additional information which was forthcoming in many cases.
Some 57 positive responses were received – many with comments pertinent to local events (fires, floods, road construction etc.) and or international happenings (9/11, SARS, GFC etc.). In most cases annual visitor numbers were supplied however some were on a “financial year” basis. These differ around the world.
In a very few cases (perhaps for ‘commercial-in-confidence’ reasons) only percentage changes were supplied. Data was supplied for periods for two to 105 years. We also had estimates of visitor numbers for some of the smaller sites.
Limitations of the survey
- We should have asked for at least 15 years – preferably all available years. Ten years misses out the 9/11 tragedy.
- We should have asked more firmly for comments on impacts of local and international events.
- A mix of periods supplied i.e. data ranges from between 2 to 105 years.
- A mix of calendar and financial years arrived. These vary from country to country and through the long runs of years in some cases.
- The very uneven geographical spread of requests (and responses).
- Only Slovakia and the Czech Republic provided data on all show caves.
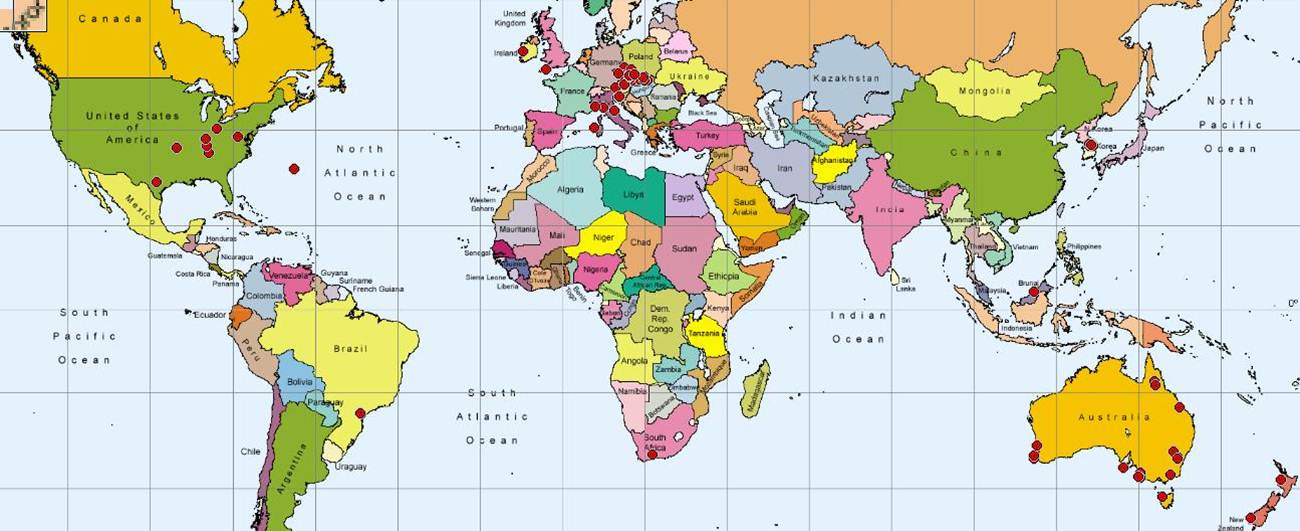
Figure 1. Location of the responding sites as shown by the red dots. Note that one dot may represent a number of separate cave sites (e.g. in South Korea) due to limitations of scale. Note also the very poor geographical spread world-wide.
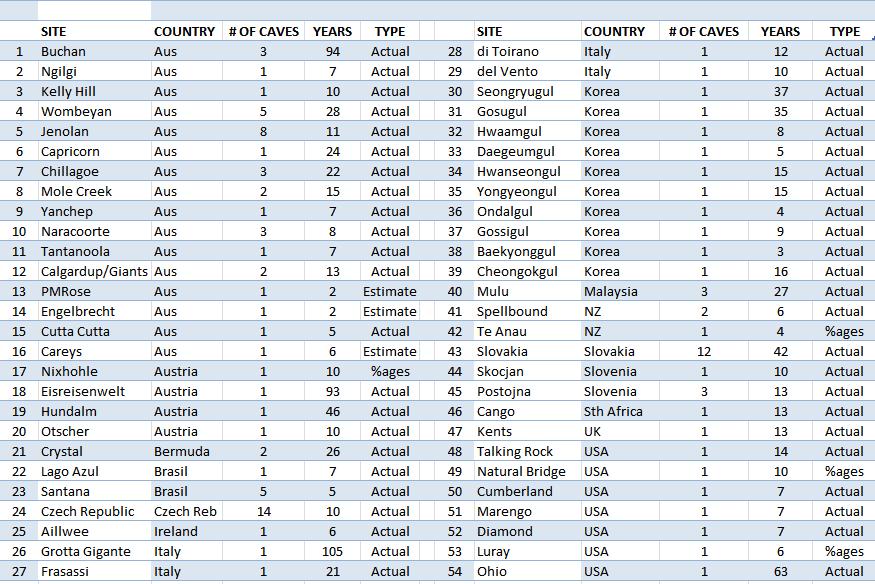
Table 1. Respondents, the number of caves represented, years of record and type of data supplied.
Methodology of the analysis
We are only skimming the surface of what is possible with datasets like these. Our results are largely visual and narrative rather than statistical at this stage. We will not be providing much interpretation of events influencing visitor numbers in this paper.
The data preparation process for an individual series went as follows:
- Some data was only provided as yearly percentage changes. In these cases the last year of complete data was given the value 1 (this can be thought of as 100% if you prefer) and the rest of the series calculated back to the best of our ability – it was not always clear whether the percentage changes given were calculated forwards or backwards, year by year or over the full period of record.
- Where 2012 numerical data existed, we normalised all previous data by this, resulting in a value of 1 for the 2012 year. In this way we intended to show rising and falling trends most clearly and allow comparison with percentage-change-only datasets.
- Datasets were then grouped by location for best illustration of national and regional responses.
Where 2012 data was not available, we normalised by the last year in the series. This does make trends slightly harder to see, but we felt this data was still valuable enough to include. Extrapolation would be the alternative and possibly dangerous.
As mentioned previously, this is a preliminary analysis only. There are a number of significant issues of which we are aware, but which have not yet been addressed. The most serious are:
- The aforementioned cases where no 2012 data exists.
- Some series were supplied with metadata noting that the years used was not calendar but financial. However, in most cases just the figures were supplied. It is not known how many series relate to financial years and which are standard calendar years. In effect this means that some series are offset by six months or other periods.
- Most of the series given relate to individual caves, but some cover entire resorts or multi-cave tours/passes.
- At present the dataset, although certainly rich enough to be interesting, is small. Most countries/regions are distinctly under-represented.
- Problems in comparing sites where visitor numbers may differ in many orders of magnitude.
- The impacts of openings and events (e.g. relighting with attendant publicity) which greatly influence visitor numbers but without specific data from operators will just appear as “noise”.
What might affect visitor numbers?
Clearly there are a huge variety of factors that influence the numbers of visitors visiting show caves. These range from international (e.g. oil prices, exchange rate variations between countries, disease outbreaks), national (e.g. the Gentle Revolution in Slovakia (known as the Velvet Revolution in the Czech Republic) –see Figure 8 below) and local such as weather events and roadworks (e.g. Diamond Caverns, USA). What may be a disaster in one country may benefit another. Regina Roach (pers. comm.) suggests that the SARS epidemic in Asia which spread to 37 countries globally in 9 months in 2002-03 lifted visitor numbers at Yarrangobilly with visitors visiting more caves and buying higher priced goods in the gift shop!
Table 2 provides a listing of some of the major world-wide events for the decade prior to the end of 2012.
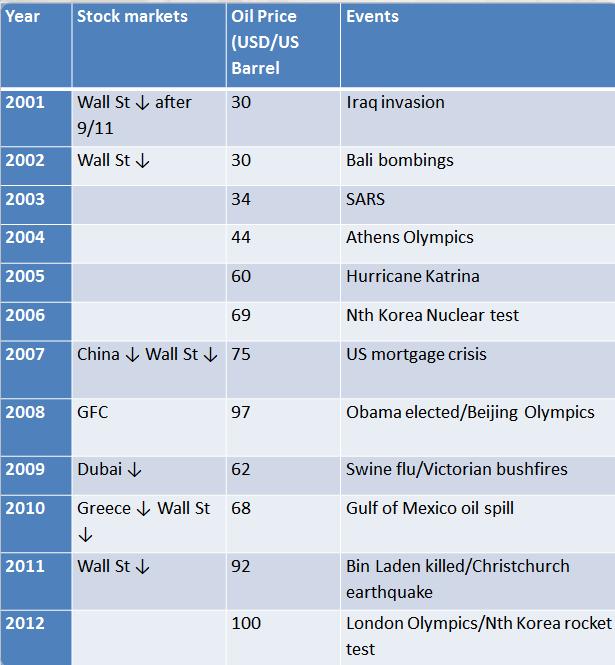
Table 2. Major events world-wide in the past decade.
A listing of local events that might impact on show cave visitation is probably limitless! Some are outlined below:
- Bushfires/wildfire e.g. Western Australia and Victoria
- Floods e.g. Jenolan, Gunns Plains, Capricorn Caverns and Careys Cave floods
- Christchurch earthquake (bad for South Island, good for North?)
- Roadworks at Diamond Caverns, USA
- Snow
- The “Wet” in Australia
- National and State awards
- Grants
- Campaign launches
- Accreditation
- Major events (e.g. sporting events)
- New management
- And many etceteras!
The results
We received datasets from 54 respondents as shown in Table 1 above. The data covers about 110 separate caves and just over a thousand years of data.
The data is presented as a series of graphs firstly of the global data we acquired and secondly by region. These are normalised to either 2011 or 2012. Cango Caves and Brazilian caves are also included although the datasets are limited in length or do not show much variation. We also provide very few long run datasets of actual numbers. The long run datasets show as much as anything the difficulty of comparing actual numbers.
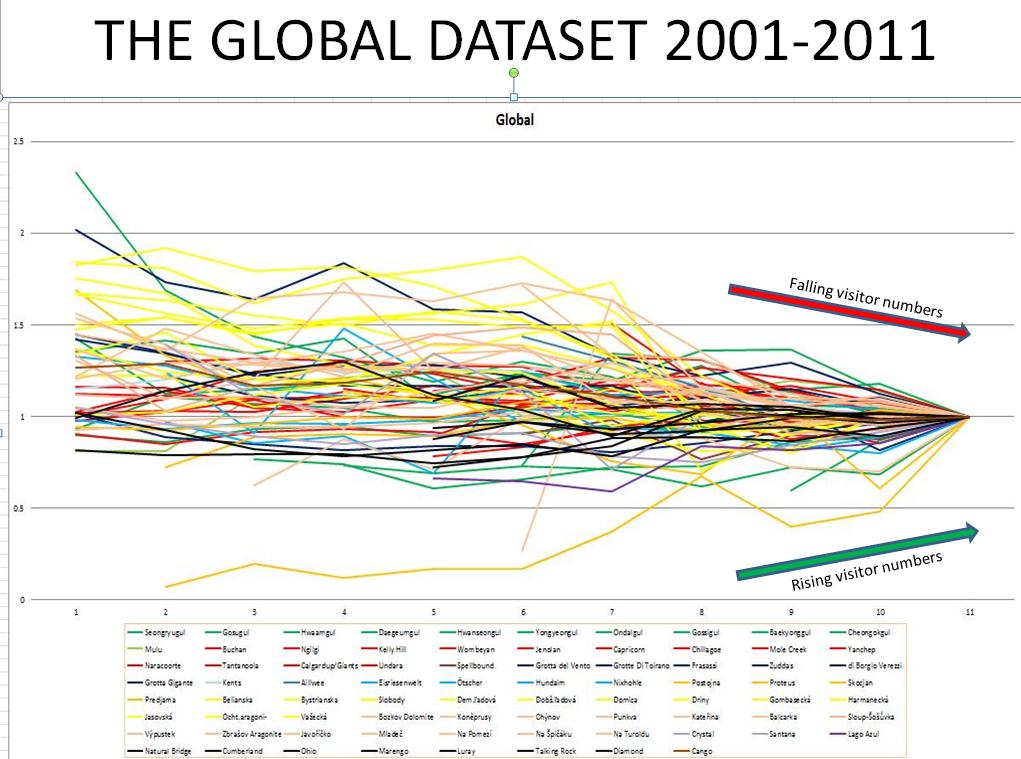
Figure 4. The entire dataset. Note the arrows showing increasing/decreasing visitor numbers. This applies to all except the long-run graphs. It is also interesting that the increasing number trends show less variability than declining trends. This is a matter to be further investigated.
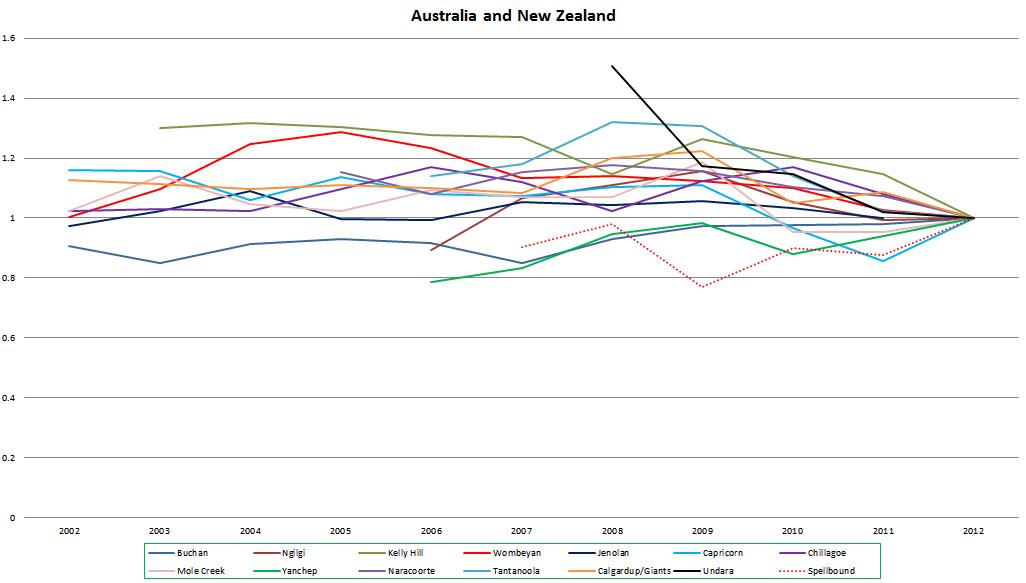
Australia and New Zealand dataset. This includes data from only 13 of Australia’s 24 show cave operations – and only one from New Zealand. In most cases the numbers have not fluctuated wildly.
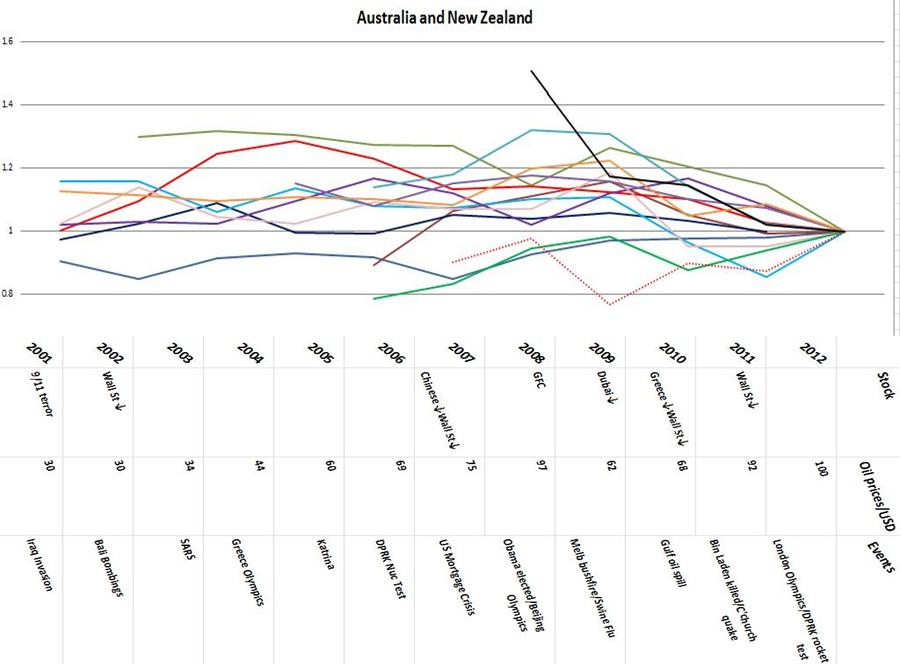
Australia and New Zealand dataset with world-wide events superimposed. Antipodean caves do not seem to be greatly influenced by world events.
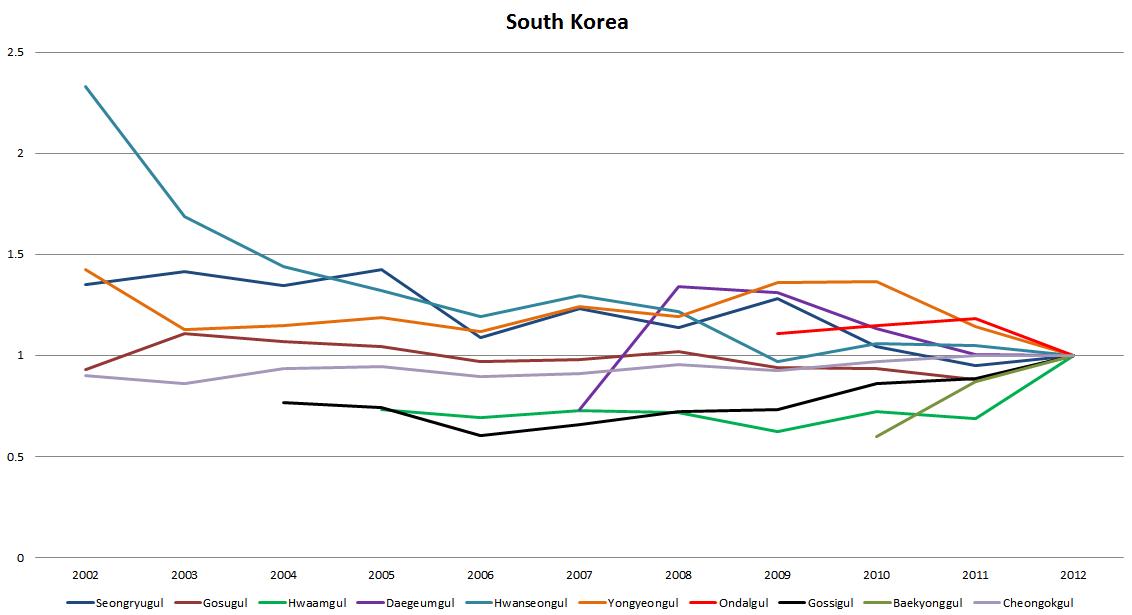
South Korea dataset. Note the very large decline in visitor numbers at Hwanseongul – the other caves are relatively static.
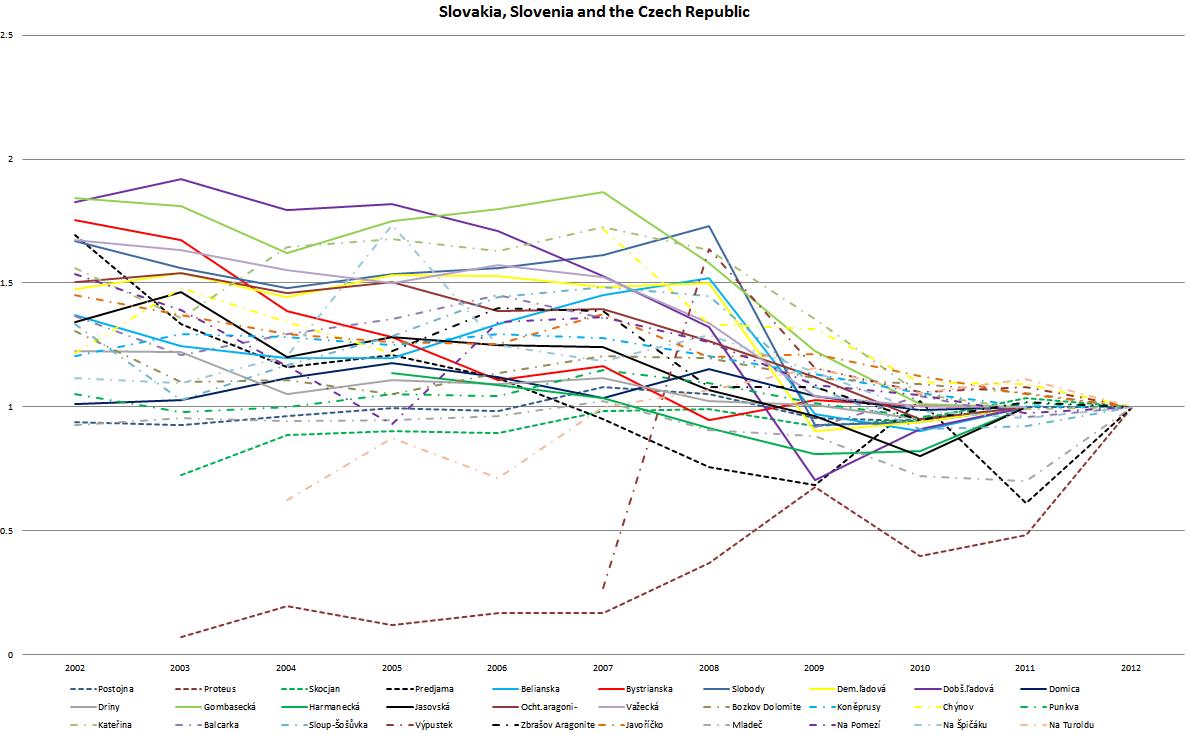
Slovakia, Slovenia and the Czech Republic dataset. Perhaps the most wildly varying data set – note the influence of the Green (Velvet) Revolution in Slovakia producing very sharp declines.
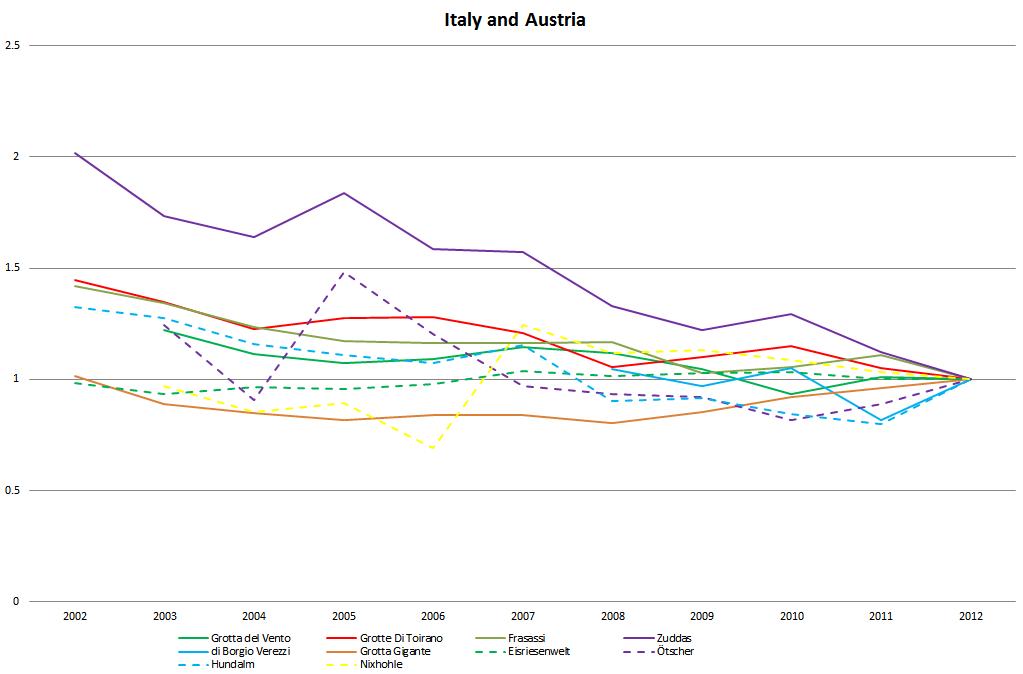
Italy and Austria dataset. Mostly a general decline here or relatively static.
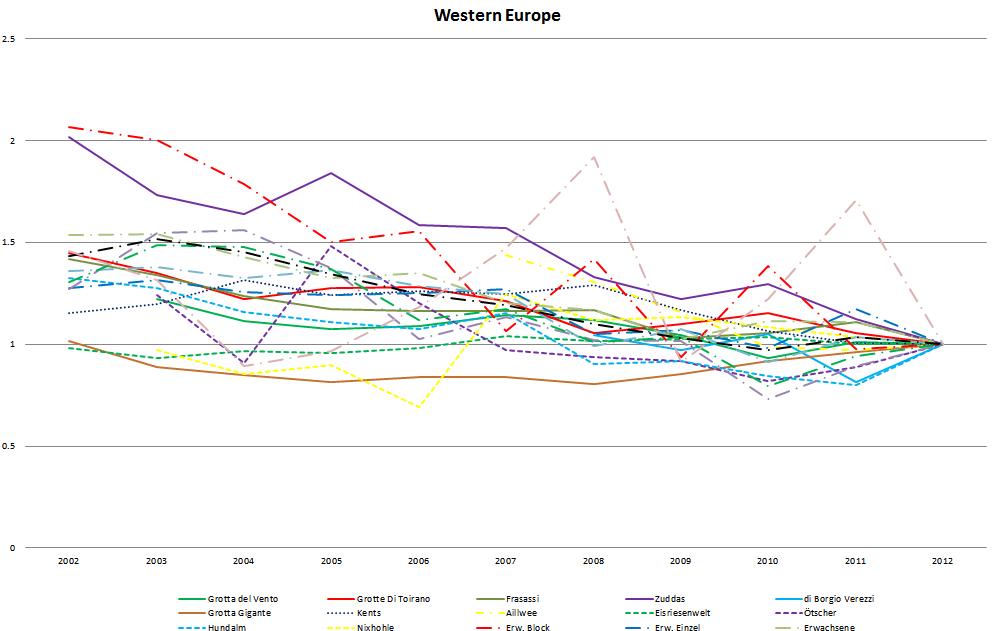
Western Europe dataset. Figure 9 above is a subset of this dataset. A similar comment applies. The brown dot-dash line should be ignored – problem with that data set.
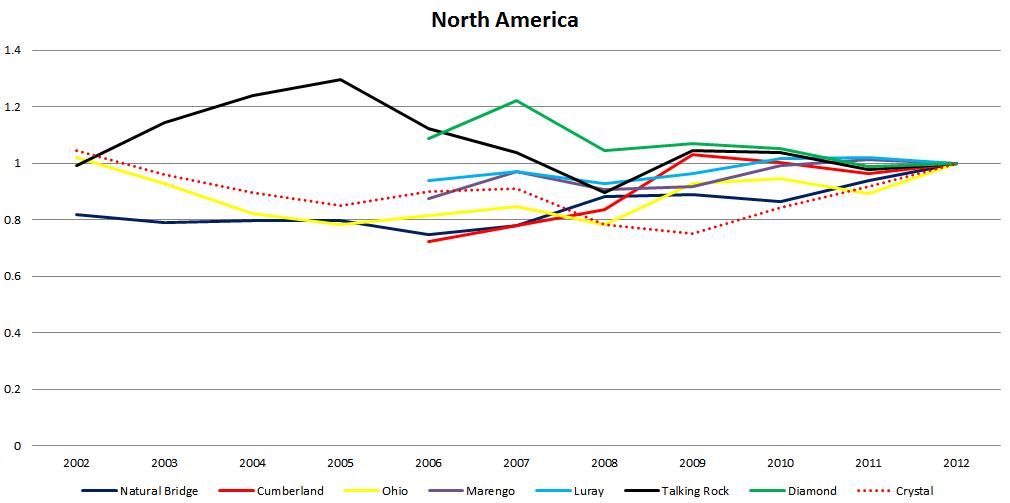
USA and Bermuda dataset. Grouped together as Bermuda’s tourism industry is dependent on the USA. Unfortunately we have only a very few caves from the US and short runs of data. However the variability is relatively low – perhaps as a result of the heavy use of ancillary operations in the USA – e.g. gift shops, zip-lining etc.
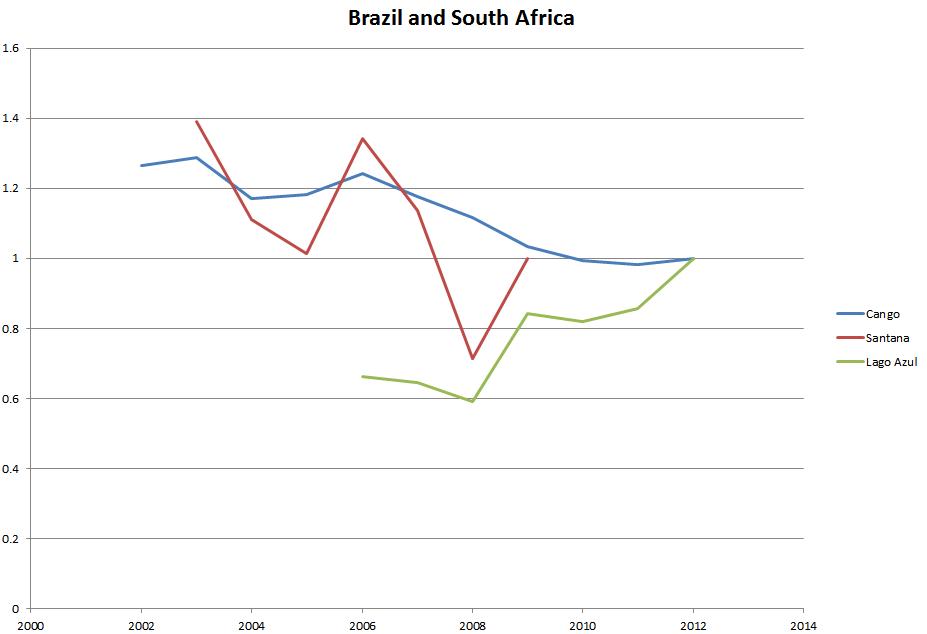
Brazil and South Africa dataset. Very limited data from Brazil and a long-term decline at Cango.
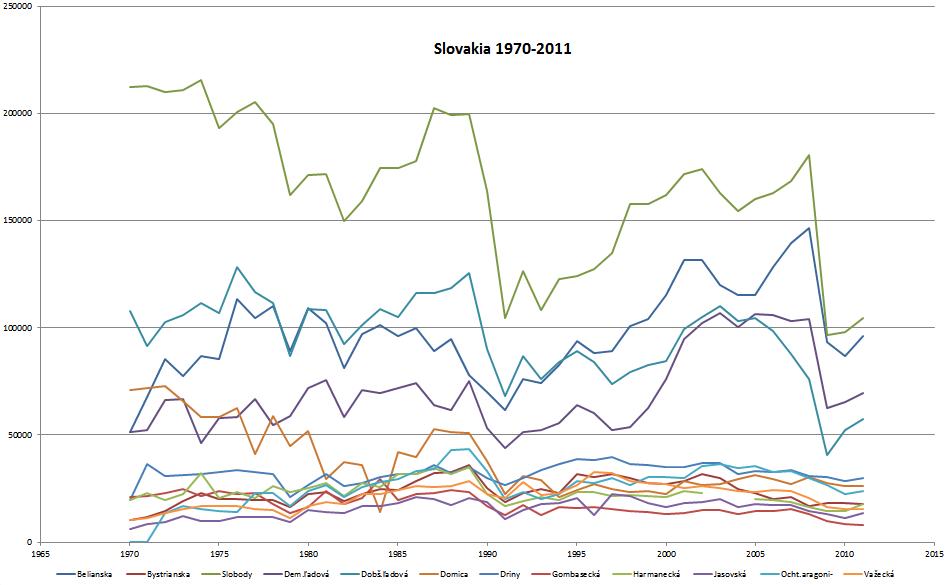
Slovakia long runs. Here we see again the strong falls as a result of the Green (Velvet) Revolution and again in about 2008 – for what reason? Why did some of Slovakia’s show caves not react strongly?
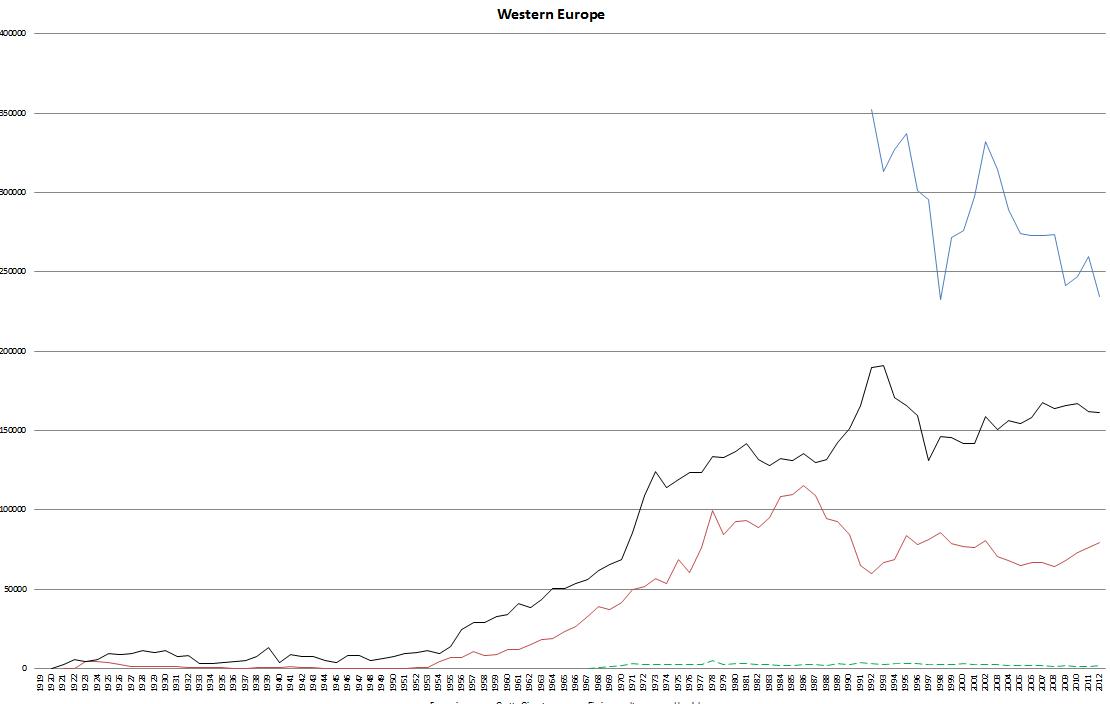
Western Europe long runs. This graph shows dramatically the issues in comparing absolute visitor numbers. Interesting that both Hundalm (Austria) and Grotta Gigante (Italy) had a spike in 1978 but opposite directions in about 1981.
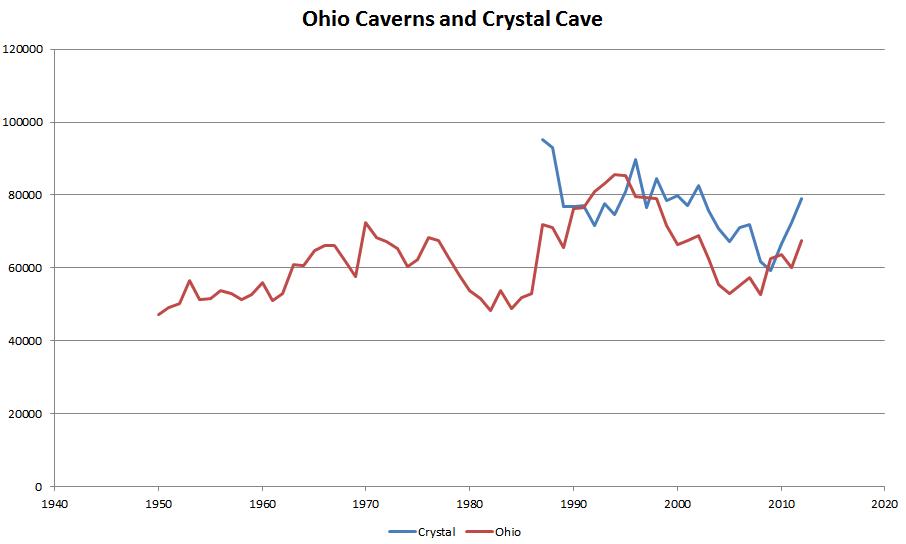
Ohio and Crystal long runs. This graph illustrates relatively well the relationship between the USA and Bermuda. The influence of 9/11 is clear.
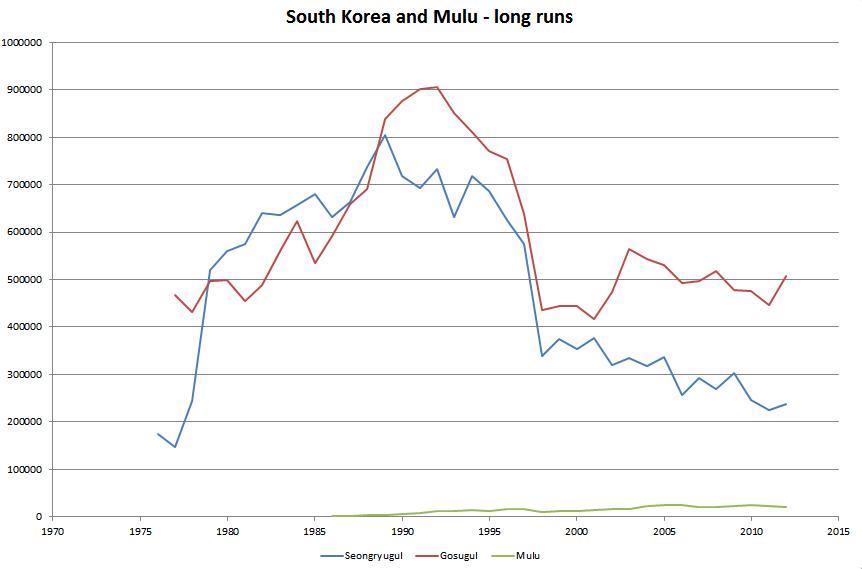
Korea and Mulu long runs. Again this shows the problems in comparing absolute numbers. The reasons for the rapid and continuous increase and subsequent decline in South Korea requires further investigation.
Discussion
According to the website http://www.showcaves.com/ there are about 1500 show caves around the world. The indications are that there are around 300 in each of the USA and China. The 54 operations reported here clearly do not represent the situation world-wide as they represent only about 4% of the total. Asian show caves in particular have enormous visitor numbers relative to the rest of the world. Apart from South Korea they are not seen in this survey.
Butler (1980) developed a theoretical model of the evolution of tourist areas. We do not see much evidence that his model actually fits the changes and trends in visitor numbers that we see in our admittedly limited dataset.
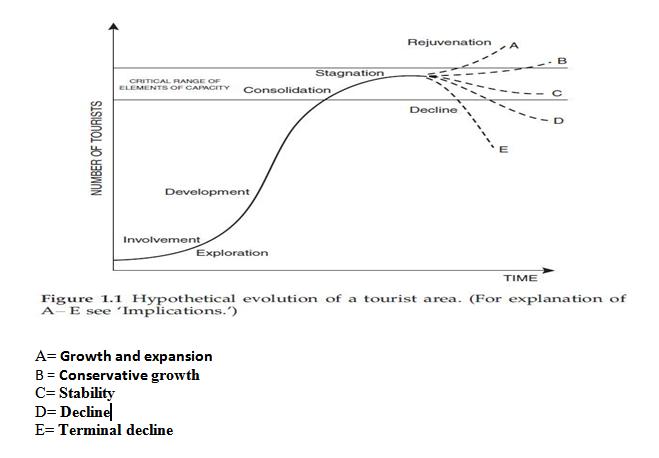
Butler’s (1980) theoretical model of the evolution of tourist areas.
The only analysis of show cave visitor numbers that we can find is that of Bao (2006) and we quote him at length:
The life cycle model was first introduced to China by 1993. Since then, various scholars have used it as a descriptive tool in several specific case studies. For example, Bao (1994, 1995) analysed the development of large-scale theme parks and karst caves. He found that caves had no obvious exploration and involvement stages, and that \development stage, visitation to such a cave will decline. (p107)
According to many cases studies (Bao, 1995), the life cycle of a karst cave is very special. They usually have no exploration and involvement stages, and their first stage is usually the development stage. Normally, caves isolated from other tourist destinations go directly to the development stage after they are open. They then will experience a short consolidation and stagnation stage, and subsequently come to a close soon afterwards. If a cave is close to a famous tourist destination, the situation will be different.
Because it is dark and dangerous in the karst cave before it is open, only a few local residents would go to it after its initial discovery. When it is better known, tourists tend to flood in. Because there are so many karst caves in China, they can only attract tourists from nearby. The number of tourists normally falls quickly after the initial influx, as shown in the cases in Guangdong and Yunnan Provinces (Bao, 1995). However, if the cave were close to a famous tourist destination, such as Ludi Cave in Guilin city, tourists to such caves would fluctuate in numbers with going to the famous tourist destination. (pp 109-110)
To us this seems so far from the reality of the situation in the rest of the world that we need to explore the subject of cave visitor numbers and their fluctuations further.
To this end we wish to:
- Extend the datasets geographically and temporarily.
- Extend the events calendar to world-wide, regional, national and local events to identify happenings that affect visits to show caves.
- Develop better methodologies for analysis.
- Investigate the differences in the variability signals between rising and falling visitor trends.
We will be seeking, via ISCA and other contacts, better datasets for longer periods and comments on what makes your visitor numbers go up and down. Especially from the show cave ‘capitals of the world’ –China and the USA. We intend, with your collective help, to expand a much extended and more thorough analysis of show cave visitor trends for the ISCA Congress at Jenolan in November next year!
Hopefully better understanding what influences visitor numbers visiting show caves will allow us to plan to avoid the inevitable pressures that affect show cave operations. To this end we seek your assistance in generating better data.
Acknowledgements
Greg Martin provided the original impetus for this paper. Many others have provided information or commentary. We thank all those below and apologise to any we may have missed. Many of the respondents provided very valuable comments which we would have liked to reproduce. However we had not asked permission to reproduce their verbatim comments so we have chosen not to include them.
|
Albin Tauber |
Eric Evans |
Kirsty Dixon |
|||||||||||||||||||||||||||||||||||||||||||||||||||||||||||||||||||||||||||||||||||||||||||||||||||||||||||||||||||||||||||||||||||||||||||||||||||||||||||||||||||||||||||||||||||||||||||||||||||||||||||||||||||||||||||||||||||||||||||||||||||||||||||||||||||||||||||||||||||||||||||||||||||||||||||||||||||||||||||||||||||||||||||||||||||||||||||||||||||||||||||||||||||||||||||||||||||||||||||||||
|
Alessio Fabbricatore |
Friedrich Oedl |
Lana Little |
|||||||||||||||||||||||||||||||||||||||||||||||||||||||||||||||||||||||||||||||||||||||||||||||||||||||||||||||||||||||||||||||||||||||||||||||||||||||||||||||||||||||||||||||||||||||||||||||||||||||||||||||||||||||||||||||||||||||||||||||||||||||||||||||||||||||||||||||||||||||||||||||||||||||||||||||||||||||||||||||||||||||||||||||||||||||||||||||||||||||||||||||||||||||||||||||||||||||||||||||
|
Alison Moos |
Gabriella Barozzi |
Mario Verole-Bozello |
|||||||||||||||||||||||||||||||||||||||||||||||||||||||||||||||||||||||||||||||||||||||||||||||||||||||||||||||||||||||||||||||||||||||||||||||||||||||||||||||||||||||||||||||||||||||||||||||||||||||||||||||||||||||||||||||||||||||||||||||||||||||||||||||||||||||||||||||||||||||||||||||||||||||||||||||||||||||||||||||||||||||||||||||||||||||||||||||||||||||||||||||||||||||||||||||||||||||||||||||
|
Ann Augusteyn |
Geoff Kell |
Mark Delane |
|||||||||||||||||||||||||||||||||||||||||||||||||||||||||||||||||||||||||||||||||||||||||||||||||||||||||||||||||||||||||||||||||||||||||||||||||||||||||||||||||||||||||||||||||||||||||||||||||||||||||||||||||||||||||||||||||||||||||||||||||||||||||||||||||||||||||||||||||||||||||||||||||||||||||||||||||||||||||||||||||||||||||||||||||||||||||||||||||||||||||||||||||||||||||||||||||||||||||||||||
|
Anne Wood |
Gordon Smith |
Mona Schaufuss |
|||||||||||||||||||||||||||||||||||||||||||||||||||||||||||||||||||||||||||||||||||||||||||||||||||||||||||||||||||||||||||||||||||||||||||||||||||||||||||||||||||||||||||||||||||||||||||||||||||||||||||||||||||||||||||||||||||||||||||||||||||||||||||||||||||||||||||||||||||||||||||||||||||||||||||||||||||||||||||||||||||||||||||||||||||||||||||||||||||||||||||||||||||||||||||||||||||||||||||||||
|
Bob Holt |
Grant Commins |
Neil Collinson |
|||||||||||||||||||||||||||||||||||||||||||||||||||||||||||||||||||||||||||||||||||||||||||||||||||||||||||||||||||||||||||||||||||||||||||||||||||||||||||||||||||||||||||||||||||||||||||||||||||||||||||||||||||||||||||||||||||||||||||||||||||||||||||||||||||||||||||||||||||||||||||||||||||||||||||||||||||||||||||||||||||||||||||||||||||||||||||||||||||||||||||||||||||||||||||||||||||||||||||||||
|
Brad Wuest |
Greg Martin |
Nick Heath |
|||||||||||||||||||||||||||||||||||||||||||||||||||||||||||||||||||||||||||||||||||||||||||||||||||||||||||||||||||||||||||||||||||||||||||||||||||||||||||||||||||||||||||||||||||||||||||||||||||||||||||||||||||||||||||||||||||||||||||||||||||||||||||||||||||||||||||||||||||||||||||||||||||||||||||||||||||||||||||||||||||||||||||||||||||||||||||||||||||||||||||||||||||||||||||||||||||||||||||||||
|
Brian Clark |
Grotta di Toirano |
Nick Powe |
|||||||||||||||||||||||||||||||||||||||||||||||||||||||||||||||||||||||||||||||||||||||||||||||||||||||||||||||||||||||||||||||||||||||||||||||||||||||||||||||||||||||||||||||||||||||||||||||||||||||||||||||||||||||||||||||||||||||||||||||||||||||||||||||||||||||||||||||||||||||||||||||||||||||||||||||||||||||||||||||||||||||||||||||||||||||||||||||||||||||||||||||||||||||||||||||||||||||||||||||
|
Brian Vauter |
Hein Gerstner |
Nicky Johnson |
|||||||||||||||||||||||||||||||||||||||||||||||||||||||||||||||||||||||||||||||||||||||||||||||||||||||||||||||||||||||||||||||||||||||||||||||||||||||||||||||||||||||||||||||||||||||||||||||||||||||||||||||||||||||||||||||||||||||||||||||||||||||||||||||||||||||||||||||||||||||||||||||||||||||||||||||||||||||||||||||||||||||||||||||||||||||||||||||||||||||||||||||||||||||||||||||||||||||||||||||
|
Dale Calnin |
Heros Lobos |
Paul Flood |
|||||||||||||||||||||||||||||||||||||||||||||||||||||||||||||||||||||||||||||||||||||||||||||||||||||||||||||||||||||||||||||||||||||||||||||||||||||||||||||||||||||||||||||||||||||||||||||||||||||||||||||||||||||||||||||||||||||||||||||||||||||||||||||||||||||||||||||||||||||||||||||||||||||||||||||||||||||||||||||||||||||||||||||||||||||||||||||||||||||||||||||||||||||||||||||||||||||||||||||||
|
Dan Cove |
Hundalm Ice Cave |
Pete Chandler |
|||||||||||||||||||||||||||||||||||||||||||||||||||||||||||||||||||||||||||||||||||||||||||||||||||||||||||||||||||||||||||||||||||||||||||||||||||||||||||||||||||||||||||||||||||||||||||||||||||||||||||||||||||||||||||||||||||||||||||||||||||||||||||||||||||||||||||||||||||||||||||||||||||||||||||||||||||||||||||||||||||||||||||||||||||||||||||||||||||||||||||||||||||||||||||||||||||||||||||||||
|
Dave Smith |
Grotte is Zuddas |
Peter Gazik |
|||||||||||||||||||||||||||||||||||||||||||||||||||||||||||||||||||||||||||||||||||||||||||||||||||||||||||||||||||||||||||||||||||||||||||||||||||||||||||||||||||||||||||||||||||||||||||||||||||||||||||||||||||||||||||||||||||||||||||||||||||||||||||||||||||||||||||||||||||||||||||||||||||||||||||||||||||||||||||||||||||||||||||||||||||||||||||||||||||||||||||||||||||||||||||||||||||||||||||||||
|
David & Julie Holdsworth |
Jody Gersten |
Peter Stefin |
|||||||||||||||||||||||||||||||||||||||||||||||||||||||||||||||||||||||||||||||||||||||||||||||||||||||||||||||||||||||||||||||||||||||||||||||||||||||||||||||||||||||||||||||||||||||||||||||||||||||||||||||||||||||||||||||||||||||||||||||||||||||||||||||||||||||||||||||||||||||||||||||||||||||||||||||||||||||||||||||||||||||||||||||||||||||||||||||||||||||||||||||||||||||||||||||||||||||||||||||
|
David Summers |
Johann Wahl |
Renata Marinelli |
|||||||||||||||||||||||||||||||||||||||||||||||||||||||||||||||||||||||||||||||||||||||||||||||||||||||||||||||||||||||||||||||||||||||||||||||||||||||||||||||||||||||||||||||||||||||||||||||||||||||||||||||||||||||||||||||||||||||||||||||||||||||||||||||||||||||||||||||||||||||||||||||||||||||||||||||||||||||||||||||||||||||||||||||||||||||||||||||||||||||||||||||||||||||||||||||||||||||||||||||
|
Deb Cardin |
John & Sue Douglas |
Rod & Isabel Graves |
|||||||||||||||||||||||||||||||||||||||||||||||||||||||||||||||||||||||||||||||||||||||||||||||||||||||||||||||||||||||||||||||||||||||||||||||||||||||||||||||||||||||||||||||||||||||||||||||||||||||||||||||||||||||||||||||||||||||||||||||||||||||||||||||||||||||||||||||||||||||||||||||||||||||||||||||||||||||||||||||||||||||||||||||||||||||||||||||||||||||||||||||||||||||||||||||||||||||||||||||
|
Deb Mara |
Julia Coggins |
Rosana Cerkvenik |
|||||||||||||||||||||||||||||||||||||||||||||||||||||||||||||||||||||||||||||||||||||||||||||||||||||||||||||||||||||||||||||||||||||||||||||||||||||||||||||||||||||||||||||||||||||||||||||||||||||||||||||||||||||||||||||||||||||||||||||||||||||||||||||||||||||||||||||||||||||||||||||||||||||||||||||||||||||||||||||||||||||||||||||||||||||||||||||||||||||||||||||||||||||||||||||||||||||||||||||||
|
Dusan Milka |
Katja Dolenc Batagelj |
Sara Bonacucina |
|||||||||||||||||||||||||||||||||||||||||||||||||||||||||||||||||||||||||||||||||||||||||||||||||||||||||||||||||||||||||||||||||||||||||||||||||||||||||||||||||||||||||||||||||||||||||||||||||||||||||||||||||||||||||||||||||||||||||||||||||||||||||||||||||||||||||||||||||||||||||||||||||||||||||||||||||||||||||||||||||||||||||||||||||||||||||||||||||||||||||||||||||||||||||||||||||||||||||||||||
|
|
Kim Lyoun |
Tanya Stiff |
|||||||||||||||||||||||||||||||||||||||||||||||||||||||||||||||||||||||||||||||||||||||||||||||||||||||||||||||||||||||||||||||||||||||||||||||||||||||||||||||||||||||||||||||||||||||||||||||||||||||||||||||||||||||||||||||||||||||||||||||||||||||||||||||||||||||||||||||||||||||||||||||||||||||||||||||||||||||||||||||||||||||||||||||||||||||||||||||||||||||||||||||||||||||||||||||||||||||||||||||
Hermannshöhle provided data which arrived too late to be included in this paper. However we thank them for their input.
References
Bao, J and Zhang, C. (2006). The TALC in China's Tourism Planning: Case Study of Danxia Mountain, Guangdong Province, PRC, Chapter 7 (pp 107-116) in Butler RW (ed) The Tourism Area Life Cycle, Vol. 1: Applications and Modifications, Channel View Publications, Clevedon, Buffalo, Toronto
Butler, RW. (1980). The Concept of a Tourist Area Cycle of Evolution: Implications for Management of Resources, Canadian Geographer, 24(1)5-12