Microclimate of a mid-latitude single entrance tourist cave
School of Geography and Environmental Science, University of Auckland, New Zealand
Introduction
Single entrance caves are commonly thought of as low energy, near static environments, mainly because of the very limited extent of air exchange with the outside environment. This means they are likely to be highly sensitive to human use and also that the environmental impacts are cumulative. For this reason single entrance caves are considered to be fragile systems where small impacts ultimately produce large effects. If this is the case, it is unlikely that single entrance caves could be sustainably used for tourism. Added to this is the fact that caves are considered to be non-renewable resources as damage to cave features may take several human lifetimes to recover, or never recover at all (Aley 1976, Gilleson 1996). Thus, to ensure a balance between preservation and use of cave resources, an understanding of the resource is crucial.
It is well established that the cave microclimate is the main determinant of the energy and moisture states of cave environments (de Freitas and Littlejohn, 1987), yet little is known about the microclimate processes that operate in single entrance caves. The current research project sets out to address this. The aims of the study were divided into three parts. The first is to examine the microclimate of the cave by identifying the nature of and controls on air exchange with the outside. The second is to assess the response of the cave to seasonal and short term variations in external climate conditions. The third is to evaluate processes relevant to tourist cave management, specifically carbon dioxide (CO2) accumulation and dissipation and moisture conditions in the cave. Flushing rates of CO2 determine mean CO2 concentrations in the cave that could result in corrosion of calcite features of the cave, whereas moisture flux determines whether or not there is long term drying through the cave, both of which can be linked directly with cave use by tourists and cave management practices.
The study site is Aranui cave in Waitomo, New Zealand. It is a single entrance, near horizontal tourist cave with a long entrance passageway leading to the deep cave zone where there is a fork in the passage. The highest point is at the Eastern Scene, and the largest volume in the Cathedral (Figure 1). The fork is in fact a smaller side passage called the Fairy Walk. The cave entrance is fitted with a grille gate and divided into two openings with one section of the entrance slightly higher and smaller than the other. The larger area is the visitor entrance (Figure 1).
Method
Air exchange with the outside is the most important determinant of cave microclimate (de Freitas and Littlejohn 1987). Air exchange controls the thermal and moisture state of air within the cave levels as well as air quality through cave ventilation (Wigley and Brown 1976, de Freitas and Littlejohn 1987, Geiger et al. 2003). Temperatures in a cave are jointly determined by the temperature of cave rock, the temperature of air entering the cave and the rate of air exchange with the outside; thus, temperature and moisture fluxes are interrelated (de Freitas and Littlejohn 1987, de Freitas and Schmekel 2003). When cool air enters the cave it warms and the moisture holding capacity of the air increases. If moisture is present along the cave walls, floor and ceiling, as the warming air moves through the cave drying of cave surfaces occurs. On the other hand, warm air entering the cave cools to the temperature of the cave walls and usually results in condensation forming on the cave surfaces when the air is cooled to dewpoint temperature (de Freitas and Schmekel 2003).
Air exchange also facilitates flushing of CO2 from the cave. There are six possible sources of CO2 in caves (James 1977, James and Dyson 1981) of which only three apply in the case of Aranui cave: microbial; respiration of visitors; and from diffusion through the soil above the cave. The study period extended over 18 months from July 2002 to November 2003. Continuous automated recordings were made of air temperatures and CO2 concentration at various sites through the cave. This was done using data loggers attached to CO2 and temperature sensors. Continuous measurement of airflow at the entrance was accomplished using an ultrasonic anemometer accurate to 0.1 m sec-1. In addition, manual readings of air temperature and humidity were taken routinely through the different areas of the cave. From these, the changing thermal state of the cave was assessed alongside rates of airflow into and out of the cave. Data on CO2 was collected along with cave visitor numbers and compared to rates of airflow to assess patterns of CO2 build-up and flushing. The results were analysed using physically based, numerical models of heat and moisture flux and cave ventilation reported in the literature and the performance of these models assessed.
Results
The results clearly demonstrate that thermal characteristics of Aranui cave are a function of distance from the entrance. The air temperature profile of the cave shows that the parts of the cave furthest from the entrance remain fairly stable, whereas areas closest to the entrance are most affected by changes in external conditions (Figure 2). Temperatures in the deep cave zone remain stable at 13°C, which is also the mean annual outside air temperature of the Waitomo region. The mean monthly temperatures recorded over the study period both outside and inside the cave are shown in Figure 3.
The results show that the warmest areas of the cave are located near the ceiling and the coolest near the floor. There can be as much as a six degree difference between the floor and the ceiling. Both vertical and the internal cave temperature profiles are linked closely to the circulation of air within the cave and air exchange with the outside. As Aranui is a single entrance cave, all air enters and exits at the entrance, with warmer air at the upper part of the entrance cavity and cooler air below. The direction of airflow depends on thermal conditions outside. When conditions outside are warmer than inside the cave, air flows into the cave at the ceiling and out at the floor. This is referred to as the 'summer' circulation pattern. When conditions are cooler outside than in the cave, the airflow reverses direction and cool external air flows into the cave at the floor and out of the cave at the ceiling. This is referred as the 'winter' circulation pattern.
Airflow changes direction because of the change in the density difference between the cave air and the external cave air (de Freitas et al, 1982). When the external air density crosses the air density of the deep cave zone, the result is a change in airflow direction. Air density is determined by air temperature and air pressure. In some large caves, big changes in air pressure outside can cause sudden, short bursts of air to leave the cave (Wigley 1967, Wood 1968), but this is not the case in Aranui cave, where air temperature is the overriding determinant of the air density. Consequently, the larger the temperature difference between the inside and outside air, the higher the airflow velocity. The lowest air velocities as well as the reversal of the airflow circulation pattern occur when the air temperature outside is 13°C (Figure 4). Over the course of 24 hours, there can be as many as two changes to the airflow pattern, as the external air temperatures rise above and sink below the 13°C mark as shown in Figure 5.
Detailed measurements made using the ultrasonic anemometer showed that the air enters the cave at the upper part of the entrance at a higher velocity than it exits in this zone. This is because the processes that determine airflow patterns are different. The 'summer' airflow pattern occurs when the outside air is warmer than that in the cave (13°C). The relatively cool air in the cave slowly drains out at the lower part of the entrance. This is a sluggish, gravity-driven or katabatic flow. Air flows into the cave in the upper reaches of the entrance to replace the air that is leaving. The reverse 'winter' airflow pattern occurs when the outside air is cooler than that in the cave (13°C). The relatively warm air in the cave flows out at the upper part of the entrance. This flow is driven by free convection as the internal cave is more buoyant and less dense than the cold outside air. Because the convection flow is more vigorous, 'winter' airflow circulation is better developed and stronger than the 'summer' airflow regime. This is also reflected in the CO2 data, with the 'winter' airflow regime acting to more effectively ventilate the cave. However, there may be other factors at work, such as friction caused by the uneven cave roof in the entrance zone, which is covered with stalactites hanging from the ceiling.
Internal stratification of air within the cave is best demonstrated in the cavernous Cathedral area. Here cool air occurs at ground level and warm air above. This stratification extends throughout the cave, but the relative thickness of warm and cool layers changes depending on the season. The air circulation pattern described above extends to the deepest parts of the cave; however, rates of flow here are very low.
The specific impacts of human use of the cave were also examined. Aranui cave is illuminated by 66 banks of 110V lights that shine onto various surfaces in the cave. In addition, there are five visitor tours daily through the cave, each being 45 minutes in duration. This combination can produce as much as a 0.7 degree difference in both air and rock temperatures, which can last several hours after the last tour has been completed (Figure 6). The variations shown (Table 1) are a function of the size of the cavern or cave passage, the number of visitors present and the length of time the lights are on. On days when there are no visitors, there is no variation in cave temperatures. In addition to temperature change, lighting is also a factor in the growth of lampenflora, which can affect cave walls in the same way as condensation corrosion through the process of chelation.
Table 1. Mean surface rock temperatures recorded over the study period.
Data is shown for two periods: 1) before visitor tours commence, 22:00 -10:00 hrs, and 2) during visitor tours, 10:00 - 22:00 hrs.
| Location | Before tours | After and during tours |
| Outside | 12.1 | 12.0 |
| Cave entrance | 11.8 | 12.0 |
| 11.8 | 12.1 | |
| 12.0 | 12.2 | |
| Entrance to Cathedral | 12.0 | 12.2 |
| 12.0 | 12.2 | |
| 12.0 | 12.2 | |
| 12.0 | 12.4 | |
| High Junction | 12.1 | 12.4 |
| Entrance to Eastern Scene | 12.1 | 12.4 |
| 12.1 | 12.4 | |
| Eastern Scene | 12.1 | 12.4 |
| Entrance to Fairy Walk | 12.1 | 12.4 |
| 12.1 | 12.5 | |
| Fairy Walk | 12.0 | 12.4 |
Another human impact on the cave is CO2 accumulation from visitors and tour guides. Concentrations of CO2 measured in the different parts of the cave clearly show the influence of daily tours. The volume of the cavern or cave passage and the length of time that visitors are present determine the rate of build-up of CO2 and the air's recovery. In the smallest cavern (Fairy Walk side passage), CO2 builds up quickly, but recovery is rapid once the visitors depart, while in the largest cavern, the build-up rate is slower and the rate of recovery is also slower (Figure 7). This is likely due to the fact airflow is faster from 'jetting' in the smaller, constricted passages. This is also evidence of the air circulation regimes described earlier extending throughout the cave, even in those parts furthest from the entrance.
Relatively small visitor numbers mean that CO2 levels never quite reached the 2500 ppm threshold taken as the point at which there is risk of calcite corrosion, caused when CO2 combines with condensation moisture to form a weak carbonic acid (Dragovitch and Grose 1990, Kermode 1980). However, it is important to note that the CO2 levels recorded at Aranui cave were similar to those recorded in the Glowworm cave nearby; despite the fact that the Glowworm cave is a well ventilated two-entrance cave and there are three to four times the number of visitors per day.
CO2 concentrations at the cave entrance were strongly influence by changes in air airflow, where concentration would increase from 200ppm to as much as 800ppm in a matter of minutes. The CO2 monitor, located 40m from the entrance at floor level, provides evidence of this. As the airflow changed direction, the monitor would switch from reading the low CO2 levels of the incoming air, to the much higher CO2 enriched concentrations of the outgoing cave air (Figure 8). This is also evidence of the effectiveness of through-cave ventilation.
The high visitor numbers in summer combined with the lower rates of air exchange and less effective circulation system result in elevated levels of CO2 in the cave during summer compared with winter. This was shown in data collected over one week during summer when the cave was closed to visitors (Figure 9). Figure 9 demonstrates CO2 flushing continuing throughout the entire period of the 25th December, which followed several days of high visitation. In this case, the peaks of air exchange occurred during the day, which coincided with the tours. At night there was very little flushing of the cave as the cave and external temperatures were similar. With no visitors, 400ppm of CO2 took about two days to drain from the cave, but concentrations of CO2 returned to the previous elevated levels within two days of tours. In general, ventilation and thus drainage of CO2 is shown to depend a great deal on the cave-to-external-air thermal gradient.
Conclusion
The results show that there are subtle but important microclimatic processes operating in a single entrance cave that determine internal environmental conditions. These are the same processes that exist in multi-entrance caves, but patterns, intensities and energy levels are different. The study has also shown that cave-to-external-air thermal gradients explain both the rate of air exchange with the outside and the patterns of airflow and circulation through the cave. These effects extend to the deep cave zone, but at a much reduced level.
The findings of the study could have some important implications for cave management. For example, the summer period is busier in terms of visitor numbers, but the results show that cave ventilation is less effective than during winter flow conditions. The there is also the question of cave management in light of vulnerability of the cave to CO2 induced calcite corrosion. During the summer both CO2 concentrations and condensation are like to be highest, combining to make this the time of greatest risk of calcite corrosion. Finally, it is clear that the lighting of a cave influences the cave air and rock temperature, which undoubtedly affects drying rates in the cave.
References
Aley, T., 1976. Caves, Cows and Carrying Capacity, National Cave Management Symposium Proceedings 1975, Albuquerque: Speleobooks, 70-71
Crossley, P., 1988. The New Zealand cave atlas: North Island. Compiled by P. C. Crossley. New Zealand Speleological Society, NZ.
De Freitas, C.R., Littlejohn, R.N., Clarkson, T.S. and I.S. Kristament 1982, Cave climate: assessment of airflow and ventilation. Journal of Climatology, 2, 383 397
De Freitas, C. R., Littlejohn, R. N., 1987. Cave Climate: assessment of heat and moisture exchange. Journal of Climatology, 7, 553-569.
De Freitas C. R. and Schmekel, A., 2003. Condensation as a microclimatic process: Measurement, numerical simulation and prediction in the Glowworm Cave, New Zealand. International Journal of Climatology, 23, 557-575.
Dragovich, D. and Grose, J., 1990. Impact of Tourists on Carbon Dioxide Levels at Jenolan Caves, Australia: an Examination of Microclimatic Constraints on Tourist Cave Management, Geoforum, 21, (1), 111-120
Geiger, R., Aron, R.H. and Todhunter, P., 2003. The Climate near the Ground, 6th Edition. Rowman and Littlefield Publishers Inc., Oxford.
Gilleson, D., 1996. Caves: process, development, and management. Blackwell Publishers, UK.
James, J. M., 1977. Carbon Dioxide in the Cave Atmosphere. Transactions of the British Cave Research Association, 4, (4), 417-429.
James, J. M. and Dyson, J., 1981. Cave science topics: CO2 in Caves. Caving International Magazine, 13, October, 54-59.
Kermode, L. O., 1980. Cave corrosion by tourists. Proceedings of the Third Australasian Conference on Cave Tourism and Management, 1979, 97-104.
Wigley, T. M. L., 1967. Non-Steady flow through a Porous Medium and Cave Breathing, Journal of Geophysical Research, 72, (12), 3199-3205.
Wigley, T. M. L. and Brown, M. C., 1976. The physics of caves. In The Science of Speleology, Eds. Ford, T.D. and Cullingford, C.H.D., Academic Press, New York, 329-358.
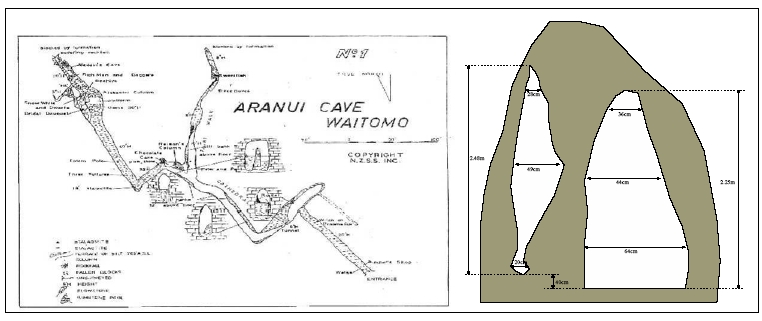
Figure 1. Map of Aranui cave (left), with entrance dimensions shown on the right. Source: Crossley 1987, p 16.
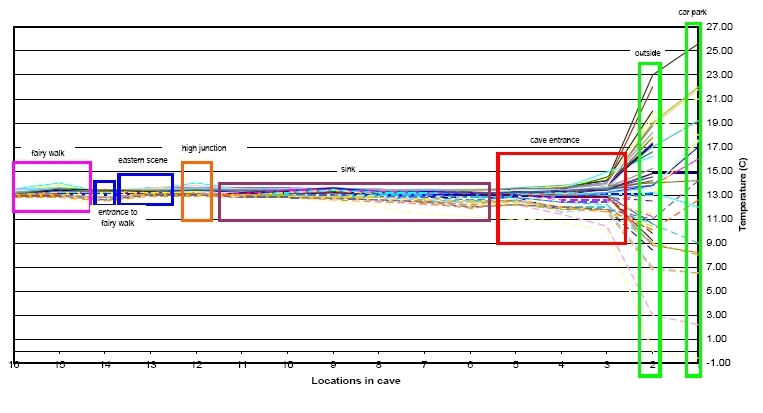
Figure 2. Dry-bulb temperatures recorded at 13 transects through Aranui cave from July 2002 to November 2003.
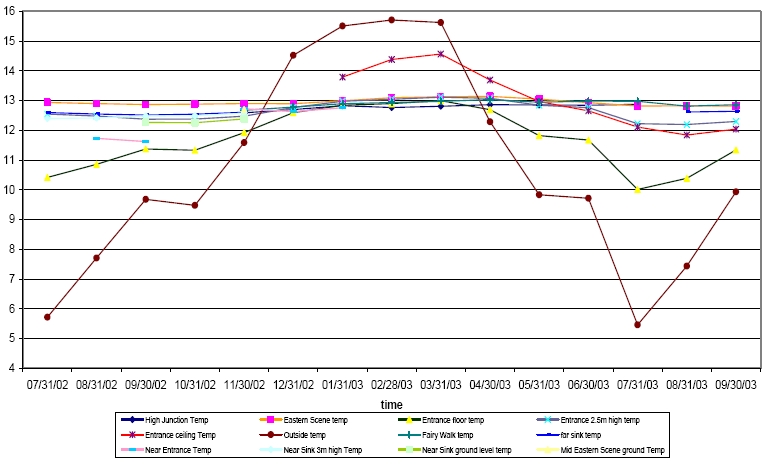
Figure 3. Mean monthly temperatures as recorded for Aranui Cave from July 1st 2002 to September 30th 2003.
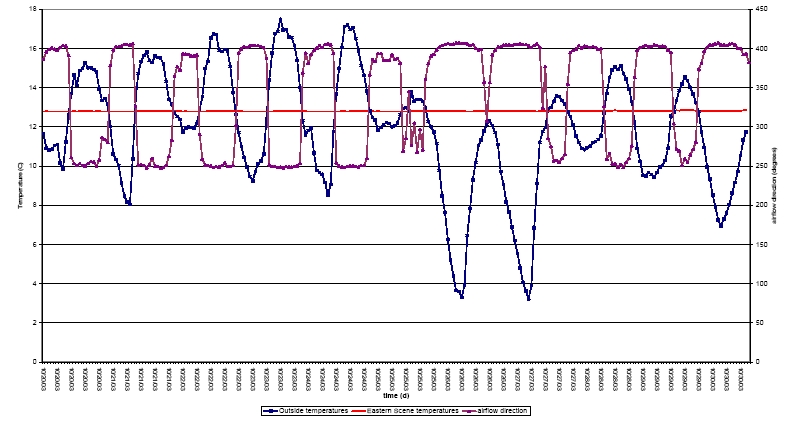
Figure 4: Patterns of interaction between airflow direction, cave air temperature and the external air temperature. Airflow direction is shown to change almost when the external air temperature crosses that of the internal cave temperature.
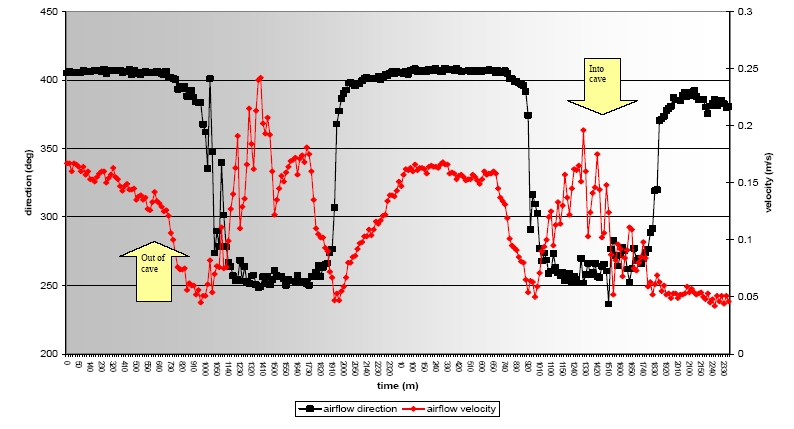
Figure 5: Airflow direction and airflow velocity recorded for two days, 6-7 November 2003, showing the relationship between changes in airflow direction and airflow velocity.
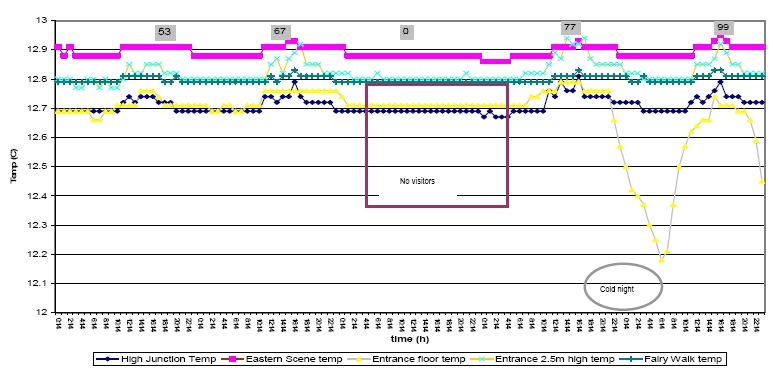
Figure 6: Air temperatures recorded inside and outside Aranui Cave, 23-27 December 2003.
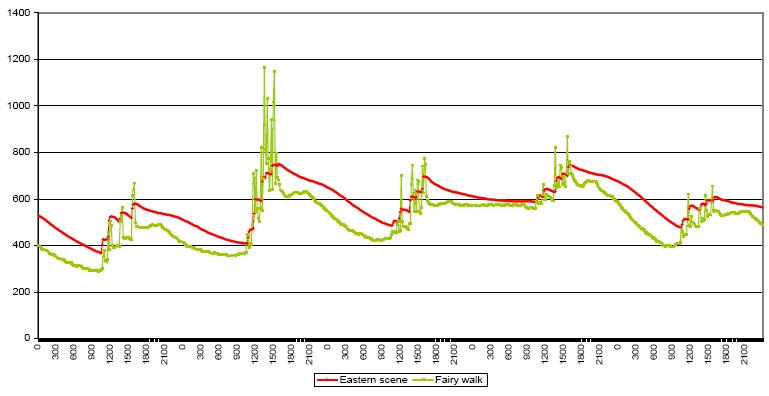
Figure 7: Measured values of CO2 at the Eastern Scene and the Fairy Walk from the 5th to the 9th November 2003.
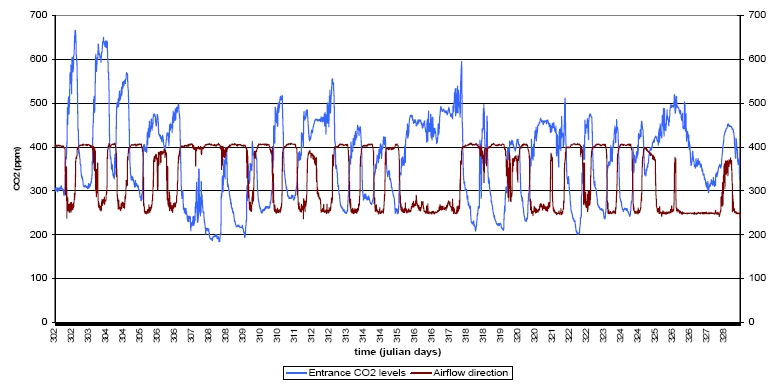
Figure 8: Relationship between CO2 and airflow direction recorded at the cave entrance, 29 October to 24 November 2003.
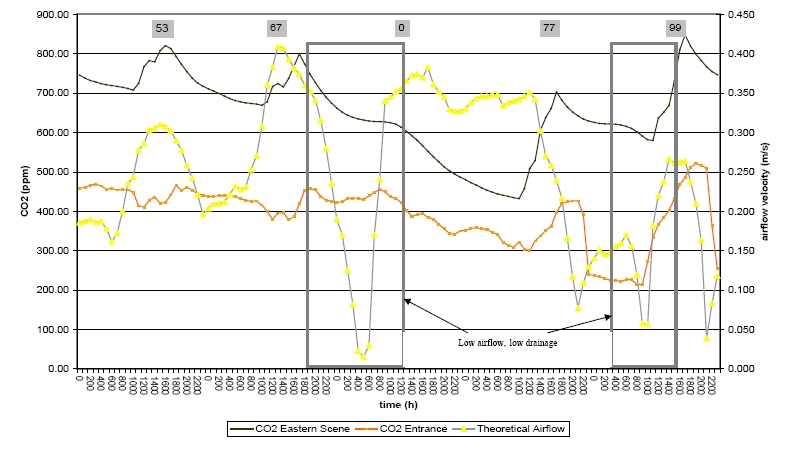
Figure 9: Measurements of CO2 concentrations at the Eastern Scene (deep cave) and the Entrance, visitor numbers and airflow from the 23-27 December 2003. CO2 drainage continues throughout the entire period of the 25th December. Visitor numbers are shown at the top of the diagram.